Forex Strategy for RSI — TS, which allows you to extract arrive on forex in trading on the currency pair EURUSD, on a five-minute time-frame (M5), trading signals in this strategy is the breakdown of the trend lines constructed on the indicator Relative Strength Index (RSI).
- On the M5 chart of EURUSD will need to tag oscillator forex RSI (21) and apply it to a close.
Entering the market as the sale and purchase produce:
- On the breakdown of the trend lines on the indicator RSI, which is necessary to build at least a 2-m points.
- After the formation of divergence in the indicator RSI.
An important condition for the deal, just a closing five-minute candle following the breakdown of this line. Open the transaction at the opening of the next M5 candles.
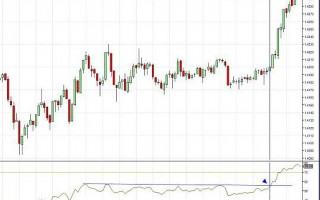
Examples of trade on forex strategy on RSI, see the figure below:

Figure 1 — open a transaction for the purchase, immediately after the breakout of the trend line on the RSI indicator
Immediately after the opening of the transaction, place a safety stop-loss order at 20 pips from entry into the market. Upon reaching profits of 10 points — move the stop-loss to breakeven!
Profit target is not set, and for profit using trailing stop at 25 pips from the price (if desired, you can use a universal trailing stop).
NOTE:
- Should not be traded on the forex strategy before, during or immediately after the release of important news in the forex market!
- Should never be removed or installed to increase the stop loss!

Figure 2 — just open the deal to buy immediately after the close of a candle, which was broken trend line on the RSI indicator

Figure 3 — is similar to the previous examples, open the deal to sell

Figure 4 — Buy, according to the rules described above

Figure 5 — Open 2 transactions: 1-for sale, 2-I for purchase

Figure 6 — The figure formed the divergence (discrepancy peaked at RSI indicator and tops the chart EURUSD), after the formation of which we can safely conclude a deal to sell

Figure 7 — another divergence of RSI — a deal to sell. And the breakdown of the trend line — a deal for the purchase, which unfortunately was closed by stop-loss.

Figure 8 — the divergence of the RSI, which may indicate the forex trader as the need to enter the market and the forthcoming fall-back or reversal of the market.

Figure 9 — is another example of Divergence RSI, after which the market turned. Break the trend line — purchase!
Template for Metatrader 4 does not spread, because on the M5chart EURUSD installed only indicator of RSI (it is present in anytrading platform, including the MT4 default (the tab menu «Insert« —«Indicators« — Oscillators «- Relative Strength Index).