Forex Strategy Weekly / Daily Trend Method is very well suited for those Forex traders who can not dedicate an entire trading day in the form of his employment, you only need once a day to scan your computer for trading signals.
- Currency pair can be any
- Time interval (recommended): Weekly (W1) or Day (D1).
To trade on the forex strategy, we need the following tools and forex indicators:
1. Indicator RSI (8) with a level 50 – the main indicator
2. Indicator MACD (12,26,9) with a level of 0 (zero line) – the main indicator
3. two indicators Slope Direction Line (15,3,0) and Slope Direction Line (30,3,0) – key indicators
4. indicator ATM_Pure_MAColor (50) – is needed to determine the direction of the main trend
5. Monthly Pivot – P-Monthly.ex4 – helps to identify the important levels to calculate the take-profit and stop-loss
6. Trend lines – to help determine the levels of stop-loss
7. LED 2MA crossover: 5 EMA close and 8 EMA open – an additional signal (arrows)
8. Fractals indicator (fractals Bill Williams) – additional forex indicator, to determine local minima and maxima (for the issuing of stop-loss).
After installing the necessary indicators forex chart MT4, our weekly or daily schedule would look approximately like this (for a larger image, click on the it – opens in new window):

The strategy Forex Weekly / Daily Trend Method is 2 kinds of signals: the conservative and aggressive.
Consider the conservative message:
1) Line indicator 2mA crossed on a weekly or daily chart, both averages must be the same color.
2) the RSI is above or below its level 50.
3) Indicator MACD: The signal bar is located above the signal line (for sale), lower – for sale.
4) All these conditions must be met at the close of weekly or daily candle.
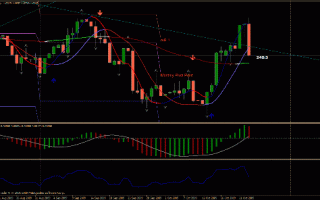
See an example of the bargain to buy (red horizontal line):

Aggressive signal:
1) Line indicator 2mA crossed on a daily or weekly chart, the color and the direction of the slope are the same (15 and 30)
2) the RSI is above (to buy) or below (for sale) of its level 50.
3) MACD: signal bar is located above (to buy) or below (for sale) of its signal line. Or prikosaetsya bar with the signal line.
4) All these conditions must be fulfilled at the closing daily or weekly candles.
See an example of an aggressive trade (red horizontal line):


To find the signal for making deals, we must first analize the weekly chart of the chosen currency pair, if no signal on the interval W1, go to the interval D1. If the signal on this pair is not found – should be exactly the same way to analize another currency pair.
Several options for Stop-Loss-a (choose the option that best suits you or is more acceptable for a single transaction):
1) Last nearest fractal – the lowest (for sale) or highest (for sale)
2) Previous weekly or daily candle
3) above / below the nearest support or resistance level
4) below the trend line (rising) to purchase or above (downward) for sale
See several options for installing the stop-loss on the same graph:

Candles marked with a red line signals at the entrance to themarket. Red arrows – installation options Stop Loss.
Profit target set at important levels (including levels of “monthlypivot“) or closing the transaction when a return signal.
- Download forex indicator for Metatrader 4 – MACD_Colored_lgtj.ex4
- Download forex indicator for Metatrader 4 – P-Monthly.ex4
- Download forex indicator for Metatrader 4 – ATM_Pure_MAColor.mq4
- Download forex indicator for Metatrader 4 – 2MA Crossover.ex4
- Download forex indicator for Metatrader 4 – Slope Direction Line.ex4
- Download a template for MT4 – weekly_daily_trend_method.tpl
Please note, all the indicators and the template should first beunzipped!