Today we look at another important and quite often appearing on the charts forex currency pairs figure charting – pattern Pennant bullish and bearish, as well as consider its differences from other, similar to a technical analysis of the figures, their differences and bargaining strategies in the forex market, the formation of the formation.
Recall that earlier we discussed with you for 2 pattern forex: Flag + Triangle and viewed as these deals for the 2nd model. Pending today’s models have some common features with the flag and the triangles and we consider them in more detail.
Description of the pattern Pennant:
This is the classic figure of the technical and graphical analysis in particular, is very similar to a symmetrical triangle (that is, the figure is well balanced), but with less time formation, and the trend line, of maxima and minima figures strongly agree.

And the flag in this figure is the same thing in common: Pennant – is just a figure continuing trends in the market! That is, the same flag, slightly directed against the flagpole, but the bottom line was not parallel to the top, and converges as the triangle. And it is the presence of the flagpole and features the same pennant from a symmetrical triangle.
Pennant is 2 types:
- Bull – pointing up the flagpole and pennant is located at its maximum (for example in the figure above).
- Bear – sent down the flagpole and pennant is formed at a minimum of movement.
Forex strategy trading pattern Pennant:
1) The graph is present a pronounced flagpole or pulse
2) At the top or at the minimum figure is formed, it napominayaschaya symmetrical triangle, but quickly emerging and reminiscent of the usual “pennant”
3) Draw for the minima of the pennant and the trend line for the maximum as the trend line, the result is a small triangle, similar as in the chart below

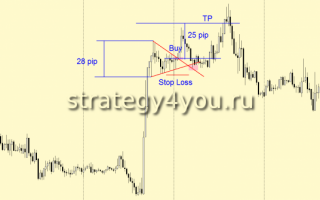
4) To enter into a transaction is usually best after the breakdown of one of the trend lines continue in the direction of motion relative to the flagpole:
– Be of a pending order buy stop for Bull pennant or sell stop to bear
– After the breakdown of what happened already, and closing the candle of the interval on which trade above or below the pattern (for example if it is clockwise, then at the opening of the next hour, we conclude a deal in the direction of the breakdown)

– To retest a broken trend line pennant – this is the best option transactions, although it is certainly not always the case.
5) Set the stop-loss at a minimum lower or higher than the previous local minimum or maximum shaped graphical model.
6) Take-profit set at least a distance equal to the widest side of the pattern. Or an important resistance level for the price, according to the rules of forex charting. Ideal – a profit equal to the height flagpole (see first picture above).
Despite the fact that knowledge is considered a pattern certainly helps traders trade in the trade, but even if you just use the rules of trading chart patterns on the breakdown of the trend line, you just can profitably sell this graphical model, as all completely graphical models are traded the same way.