Dear Forex traders, still charting forex lessons and in particular the study of graphic figures, today we look at the figure of the forex technical analysis – Pattern Wedge and the peculiarities of formation and trading strategies:
First of all, it should be noted that this figure is usually just a figure of fracture trends or trend in the forex, the type of broadening formation, which we have already reviewed on this site! That is, the wedge is usually at the top or bottom of the market, only the trend lines converge. Sometimes this figure is also called “diagonal triangle”.
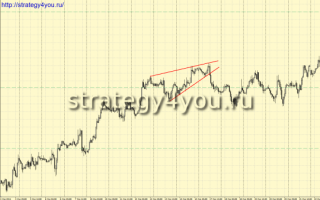
Pattern WEDGE – a figure forex technical analysis, in which the converging support and resistance lines, and the direction of forming the shape coincides with that of her previous trend.

If the wedge is directed upward in an uptrend, the fastest of its breakdown will occur down and the trend will reverse. If it is directed downward in a downtrend – the same trend can break up.
But if the wedge is directed against the main motion, that figure will most quickly be a continuation of movement. That is, breakdown occurs mainly in the direction opposite to the slope of the pattern of forex trading, although not necessarily …
In the same way as the pennant, it is wedge of 2 types:
- Ascendant – is formed at the peak of the market and is usually a model for the fracture trend down in the breakdown of its lower trend line.
- Top-down – is formed at the minimum of the market and is usually a model for the fracture trend upward in the breakdown of the upper trend line

Forex strategy trading pattern “Wedge”:
1) At the top or at the minimum of the trend movement is formed by the figure, the trend line which converge
2) Draw on the lows of this pattern, the trend line and the maximum of the same trend line, the result is a shape or pattern of the “wedge”
4) To enter into a transaction is usually best after the breakdown of one of the trend lines, especially if the breakdown has occurred against the inclination of the figure:
– Be of a pending order buy stop for a downward shape, or sell stop to the rising, set the pattern for the last extremum
– After the breakdown of what happened is the trend line and the closing of the candles (for example, if a time interval, then at the opening of the next hour, we conclude a deal in the direction of the breakdown)
– To return to a broken trend line – a broken trendline retest Wedge – this is the best version of the course of transactions, it is not always the case.
5) Be sure to install a safety order – Stop-loss is at least lower or higher than the previous local minimum or maximum shaped graphical model, depending on the breakdown.
6) Take-profit is usually recommended to install at the beginning of pattern formation, or of course easier to calculate the profits under the rules of forex charting, like we do in forex predictions of this site (important trend lines, Fibonacci levels and more).
In conclusion, the description of the pattern and strategy Forex Trade of the graphical model say:
- of course, any forex trader who wants to devote to trading forex at least part of his time, it is desirable to know the major figures of technical analysis and distinguish between them, much less know the main consequences of the formation of these models.
- But just as it should be noted (and I think you’ve already understood), that all these figures graphical analysis can not know, and need only know the basic rules of trade, according to technical analysis and graphic in particular, that we are constantly talking on this site projections in forex trading.