Dear Forex traders, we now consider the Expanding Triangle Pattern [Forex & Crypto Trading Strategy], as well as expanding formations and define the basic requirements for their formation as well as graphic patterns represent a well-established model of forex trading, which allows more likely to assume as a lead market price for the formation of a graphical model of forex trading.
And so expanding triangle — is a graphical model, which appears as a result of uncertainty in the market, but the trend line by its maximum and minimum do not converge, like the symmetrical triangle, and the odds! This type of triangles appear on the Forex market very often, but still appear in the same way that they notice and consider the best in their trade.

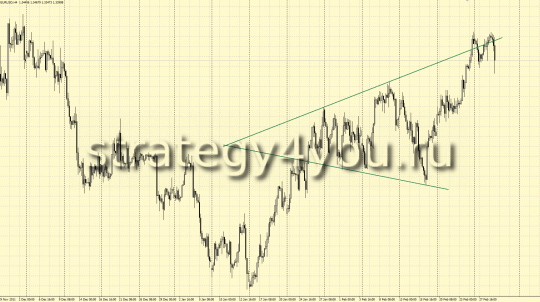
An example of an expanding triangle on the current situation on the EURUSD (intervals of H1-H4)
For the formation of an expanding triangle requires at least 4 points: 2 minimum and 2 maximum. It may be more common ground, but four — this is a minimum. And the lines of this figure is usually located under the equal angle to the horizontal, the type of symmetrical triangle and continued to the left of the triangle is usually converge at one point. In the triangle is a prerequisite for lowering the following minimums and maximums rising following in the figure.
Sometimes these triangles smoothly into the symmetric triangles and the pattern is formed as a result of «Brilliant«
Some traders say that should not be confused growing and expanding triangle and formation, in principle, they are right!
But by and large, for us there is not much difference, it’s on the market formed a triangle formation, or, more importantly understand that it is still expanding trade in the figure and it is quite difficult, and just as difficult to determine when to buy or sell it or its breakdown.
Now let’s look at what is a expanding formations:

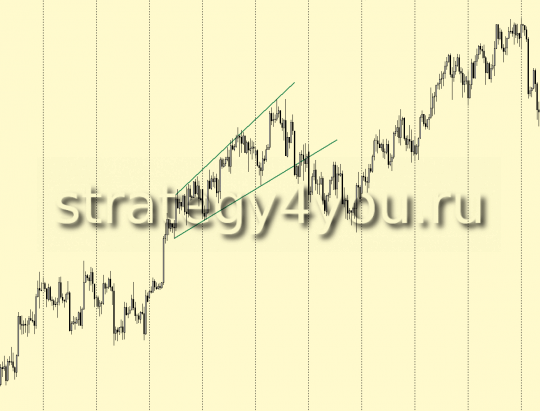
To form the expanding formations need 5 points, for example, 3 of the maximum and minimum of two, with the figure resembles a wedge, but growing, that is, the line is not located at equal angles from the horizontal, like a triangle, and slightly raised up for the highs and the uptrend consistently increasing and in the same way and lows within the figure.
Line is slightly lowered for the downward trend and the highs and consistently reduced in the same way and lows within the figure.
With explores remember that in this formation are often false breakouts its borders!
Of course, these two models are different, but they do have common characteristics — they are growing, they are usually considered reversal. But of course, since this model is still uncertainty in the forex market, then come and continue the movement after its formation.
Every forex trader sells a logical question arises: «How to trade or expanding triangle formation, and when the deal — from the boundaries inwards or their breakdown?»
But unfortunately the answer to this question can not give a definite. Many say that it is better not to trade in these figures, and wait for the final denouement, or their breakdown.
I can say that by and large better not try to sell itself this figure, if it is small enough, and if it is large enough (as an example of EURUSD at this point in the market), then the trade can simply use the rules for graphical analysis of trade inside and outside of it: the breakdown of trend lines and retest, but did remember that the trend is uncertain and the denouement of events may be double in the breakdown of the boundaries of these figures!
Also, in my opinion, it is better option to enter the market will retest it pierced in one side of the trend line and possibly combined with Fibonacci levels from the last movement.
Video:
Vodeo 2:

![Expanding Triangle Pattern [Forex & Crypto Trading Strategy]](https://strategy4forex.com/wp-content/cache/thumb/a1/044269926ca3ea1_320x200.png)