The strategy to trade the financial markets, “The Holy Grail”
If you are already trading for a while on the Forex, you probably have heard of such a term – “Purchase of the Grail” and “sale of the Holy Grail.” Sometimes “buy the Holy Grail,” also called “depression”, implying the place where it can be made a purchase. “Sale of the Holy Grail,” also called “bell”, meaning the place where it can be produced for sale. In general, this trading strategy is called “trading with the holy grail, this trading strategy was proposed by Linda Bradford Raschke, and was presented in the book” Fast Trading on Wall Street. ”
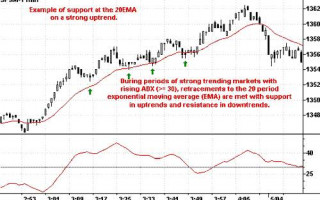
This trading strategy is not particularly new in the financial markets. It has long been widely used by traders on the trend with moving averages. The main criterion is to achieve buy on pullbacks in an existing uptrend or sell on pullbacks up with an existing downtrend. An important point when using this strategy is to eliminate trade in sideways. Linda Raschke to determine the strength of a trend suggested using 14-day ADX, as well as the exponential moving average with a period of 20 (20 EMA), to determine support and entry points.
As soon as the ADX begins to rise, and its value becomes greater than 30, and recovered back to the 20-period EMA, you should buy. This principle of trade works well for determining the entry points as in periods of upward trend, and during the downward movement.

In those moments, as the market begins to develop a strong trend and the value of ADX is greater than and equal to 30, while returning to the 20-period moving average (EMA) value of the price. And the price for this meets along the way support for the trend towards upward (ascending) and resistance at trends, downward (descending).
The whole essence of this strategy, “St. grail “is to go in the direction of emerging or already existing trend with kickbacks. This roll is also called “recovery.”
1) As soon as the ADX index will rise, we will seek recovery of EMA with a period of 20 to find a point of entry into the market.
2) Since the ADX index typically has a value of more than 50, and once the trend is near completion should stay out of the market.
3) Attention should be paid also to the emerging “Flags” with decreasing volume.
To consolidate the theory of this trading strategy, consider the example number 1:
In this example, considering the daily chart, from a peak on April 7, began the process of consolidation. First, it should be noted that the volume and the ADX also began to decline, as the price on the chart has formed a graphic shape – a triangle. Further, 12 May, the price tried to break above the downtrend line (shown in gray line on the graph size).
This attempt was met the next day for sale and also formed an important day reversal, once the price was higher during the trading day, but closed below the closing level on May 12. Traders who opened the position at the break, were completely wiped out, because price dropped again in the border triangle, and the downtrend line has been changed – the blue line. Further, June 4, the price on the market again tried to break the downtrend line on the volume, but the next trading day again met this attempted sale.
It should be noted that the ADX went “sideways”, and not down, because there was no downward movement, combined with the movement of bars up, and this fact has started to impact on the calculation of the indicator ADX.
Next was again rolled back to the moving average, and the were only “downstream” and “internal” bars until June 15, once the price was in its very narrow range since June 4. It should be noted that the volume of deals was down on this pullback, thus forming a nice bull flag. Because testing support at the 20-day moving average (EMA) was realized for the price in the market came the moment of truth. June 16 was broken by the downtrend line of bull flag on the chart size. ADX has moved up at the same time, because began to develop trend up only 3-day decline, that is: June 22, July 7, July 13.
I bought traders in a bull flag were two options:
1) aggressive option – it lay in the fact that it was necessary to put the pending orders to buy above the high of each day in a downtrend while placing the initial stop-loss order just below the low of the day, at a time when the warrant was executed.
2) conservative option – it lay in the fact that it was necessary to put a warrant to purchase a little above the maximum of the first day of an increase, that is, June 16. At a time when the buy order was executed, the initial stop-loss order should be placed just below the low on June 16. Further, traders could follow the price on the market, while using the stop placement Dunnigan method for calculating the bars.

Consider the example number 2:
This example shows the intraday charts are very popular and very liquid market instrument – futures contract, S & P.
And so this morning, July 19 on the chart the September S & P futures were made “2B top trader Vic” and the market price immediately fell clear through the 20-period moving average EMA to around 1421 before could be restored to her again. By that time, as soon as he reached the 20-period EMA moving average on 5-minute chart, selling traders who trade both at 5-minute chart, and a 15-minute interval were in the price level of 1425, ready for sale.
This facilitated the installation of first sale, “St. Holy Grail. ” Traders who prefer an aggressive style of trading can get into the market by placing an order for sale under the ascending bars, to open positions. Another installation <St. Grail> was absolutely the same as the first. 3rd and 4 th units were much more complex. Our open position in the 3 rd case would be closed by a close stop-loss order, and in the 4 th case even trading position and would not have been open since had the opportunity to reverse the trend of trade due to the “1-2-3-testing Trader Vic.”
It should be noted that whenever the market fell back again to test at least before the stimulus after a bearish flag, where the goal is to price was reached. Any further price movement has brought an additional income for selling of traders.

Consider Example 3:
In this example, the S & P index closed at its low of the previous trading day. On the Exchange Globex, the maximum was 1296.60 with a minimum at 1283.60. How much is something many traders often consider these points as important support and resistance levels, we define them as “anchor points”, together with the previous day at 1283. Obviously, the S & P was at that point in a downtrend, but it opened the next day with a gap up and made three 5-minute bottom-up “Candlestick (higher highs and higher lows much about the previous bar). We began trading day, draw a horizontal line at 1283, with the potential installation of “1-2-3 Trader Vic.”
Once the trend has reached a level of resistance from the top (for a maximum of 1296.60 and a 20-day exponential moving average (EMA) to 1297.44) and could not go higher once appeared selling traders. As soon as at least the third “upward” candles on 1293.50, which formed a white “shooting star” (shown by the arrow on the chart) was broken, it was a signal to start selling with the expectation of a minimum test at an important level – 1283. Sale, according to the trading strategy, “the Holy Grail,” has been implemented.
Sales were to occur immediately after experiencing a level of 1293.50 with a stop placement at 1295.80 – a morning maximum price in anticipation of testing minimum in 1283. The risk in this case amounted to 2.3 points against the desired return of 10 points when testing grounds – and this gives the ratio of profit to loss is better than 4:1!
Then, the S & P made a “2B” basis (the same strategy, but in the opposite direction) and the market price has increased to the maximum of the trading day, which was held magnetic effect of warrants for the purchase.