Forex strategy “BOLT” is a classic trading system. There are quite a lot of such strategies based on a similar principle published on our website. However, this one showed good stability for various instruments, so we publish it.
Statistics:
From November 2021 to November 2022, we tested this system for two pairs (GBP/USD, EUR/USD). She showed a result of +900 points for each of these pairs.
- Currency Pair – We only tested EUR/USD and GBP/USD, but the strategy is multi-currency.
- Time interval – trading on intervals starting from M5 is possible (we only checked H1).
Indicators:
- Bollinger Bands indicator with period 30, deviation 3.
- HLCTrend indicator with 5 parameters; 13; 34.
Conditions for BUY according to the Forex Strategy “BOLT”:
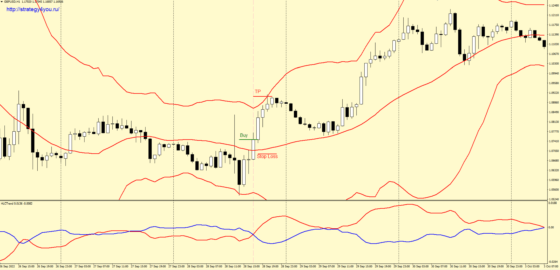
1) The price touches the lower line of the Bollinger Bands indicator.
2) As soon as the red line of the HLCTrend indicator crosses the blue line from bottom to top for the first time, we can assume that the signal has been received.
3) The main thing is that before receiving the signal, the price has not yet touched the upper line of the indicator.
4) If all conditions are met, then at the opening of the next candle a buy deal is made.
5) Stop loss is set for the last major low, but it should not be more than 50 points.
6) Only when the upper line of the Bollinger Bands indicator is touched, the transaction is transferred to breakeven, if it has not been closed for some reason before.
7) Take profit is not initially set. The deal is closed when the top line of the Bollinger Bands is reached, but if the current TP size is less than 2 to 1 in relation to the stop, then at this moment you should set the TP in the amount of twice the stop size and leave the deal active (taking into account the previous point).
SELL conditions:
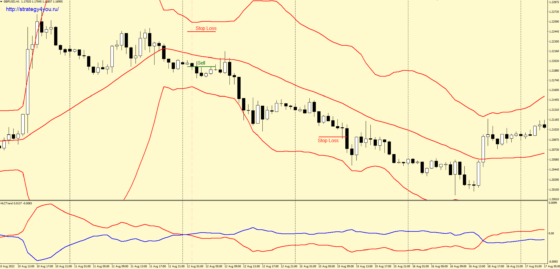
1) The price touches the upper line of the Bollinger Bands indicator.
2) After that (as soon as the red line of the HLCTrend indicator crosses the blue line from top to bottom for the first time), we can assume that a sell signal has already been received.
3) The main condition: before receiving the signal, the price has not yet touched the bottom line of the indicator.
4) If all the conditions have been met, then at the opening of the next candle (the selected interval for trading), a sell deal is concluded.
5) Stop Loss order is set for the last main maximum, but it should not be more than 50 points.
6) Only when the price touches the lower line of the Bollinger Bands indicator, the transaction is transferred to the breakeven point, if it was not closed earlier for some reason.
7) The Take Profit order is not initially set. The deal is closed at the current price when the bottom Bollinger band is reached, but if the current TP size is less than 2 to 1 in relation to the stop, then at this moment you should set the TP in the amount of 2 times the stop size and leave the deal active ( considering the previous point).
Video version of the forex strategy «BOLT»:
- Recommended to watch with English subtitles
- Download indicators – Bolt_indicators (archived).
- Download the MT4 template – bolt_tpl (also in the archive).