Pattern «Folding meter» is sometimes also called «3-stage trend line» — a very simple strategy of forex trading (forex model), which is used on virtually any currency pair and is suitable for absolutely all time intervals. This model is a signal of trend reversal, so it is necessary that it formed before taking any action.

When trading forex, fans of «catch» the big trend is very often necessary to wait for the moment a trend reversal, but it is sometimes not as there is no … And then when you just briefly distracted — and he, as it turns out, was right there, this is the trend reversal. Only manages his words, but sometimes it is too late to enter the market. Because movement through a third trend line is so fast that sometimes it is just not catching up.
But oddly enough, identifying patterns of data breaches, has been found a very simple geometrical structure (pattern), which was not mentioned in any of the books on technical analysis (graphical analysis). So she was called — «folding rule» (folding rule).
Using this pattern of «folding rule» — you can enter the market in the early stages of a trend reversal.
And so to enter the market to sell (short position) on the pattern of the «folding rule» should be:
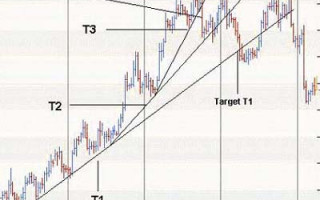
1) We provide a trend line (T1) on the grounds of 2 with respect to the newly formed basins (area support).

2) Then, the market typically begins to develop momentum, and we are after, he formed — hold 2-nd trend line (T2) on the grounds of two relatively newly formed cavities. Very often, we can clearly say when it came time to conduct trend line (T2), because the market will move quite sharply from the trend line (T1). Once the market corrects, but does not reach the trend line (T1), it’s time to add the following line.
3) The final stage of the model — when the market starts to pick up speed and it is often the movement of exhaustion, and then we build a third trend line (T3). This movement has the same characteristics as the line T2.
After all these constructions — you can clearly say that we are willing to trade.
When the trend line was broken T3 price — we are entering the market, opening up a trading position for sale at the break of the trendline and the closing prices of the candles below this trendline. Our safety stop order should be placed above the largest peak — the top of the upward movement. After that you should set a goal to achieve a profit — and this goal will be to the trend line (T1).
Log in to BUY pattern of «folding rule»:

1) conduct a trend line (T1) in spikes two not so long ago formed the peaks (of resistance).
2) the market increases the momentum, and we will then hold the 2 nd trend line (T2) of thorns two more not so long ago formed the peaks (of resistance).
3) The price in the market is accelerating, and this movement is very often the movement of exhaustion — we are the third trend line (T3).
After all constructions — we are ready for a deal on a purchase.
When the trend line (T3) was broken at the cost and the price closed below it — we conclude the deal in the long side (ie the purchase). Our safety stop-loss order is placed below the last minimum of support — which is the basis of the past downward trend. Set profit target (Teyk-profit) — trend line (T1).
In the same way as in the cases of the sale of pattern «folding rule» as soon as we leave the market with a profit on the trend line (T1), we still continue to monitor the behavior of prices in the market — what happens next. If the price finds resistance at T1, and continues to decrease, we wait until the formation of the next opportunity to enter a trading position on a purchase. If the market continues to break through the resistance trend line (T1), then this breakthrough is a strong indication that all the trend tends to unfold in the near future, and we must consider another opportunity to re-enter a trading position on a purchase.