Very often in the forecasts on this site we mention the ABC combination or pattern, but strangely enough, the question is constantly repeated and many traders confuse it with the flag pattern, which we have already considered twice on this site, so today we will take a closer look at the ABC pattern and its features of formation and development.
As we know, the movement in the market proceeds in waves. If we say that there is a trend, then this does not mean only a unidirectional movement, it’s just that the wave along the trend in the considered time interval is greater than against it (correction).
During the period of corrective movements, so-called continuation patterns are often formed on the market, that is, certain combinations formed on the chart allow us to say with even greater confidence that we are in the stage of correction, and when it is formed, the trend will resume in the same direction.
It is very important to learn how to recognize such patterns in the market in a timely manner, so that we understand which trend will prevail in the future and how you can earn on these combinations.
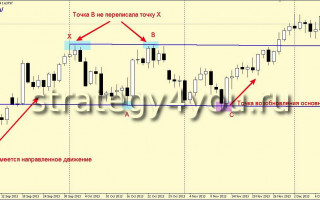
Today we will talk, as I said above, about a fairly effective combination called the ABC pattern (see an example in Figure 1):
Explanations for the example in Figure 1:
There is a directional movement in the market (upward in our example). When a certain resistance level is reached, the price forms an extremum (X) and then rolls back in the opposite direction. However, the price fails to go far and another extremum is formed (in our example, the minimum is at point A). An attempt should be made to rewrite the main extremum (X), but the price does not have enough strength, which is why point B is formed and another rollback against the trend begins. We draw a trend line along the two highs formed (with the main trend down – lows), and also draw one more from point A parallel to this line. Thus, we get a correction channel and when approaching its lower border (the line from point A), a point is formed C, from which there is a high probability of resuming the main trend.
Ways to enter the market (make a deal) using the ABC combination:
Only on the basis of the described model to enter the market is not very safe.
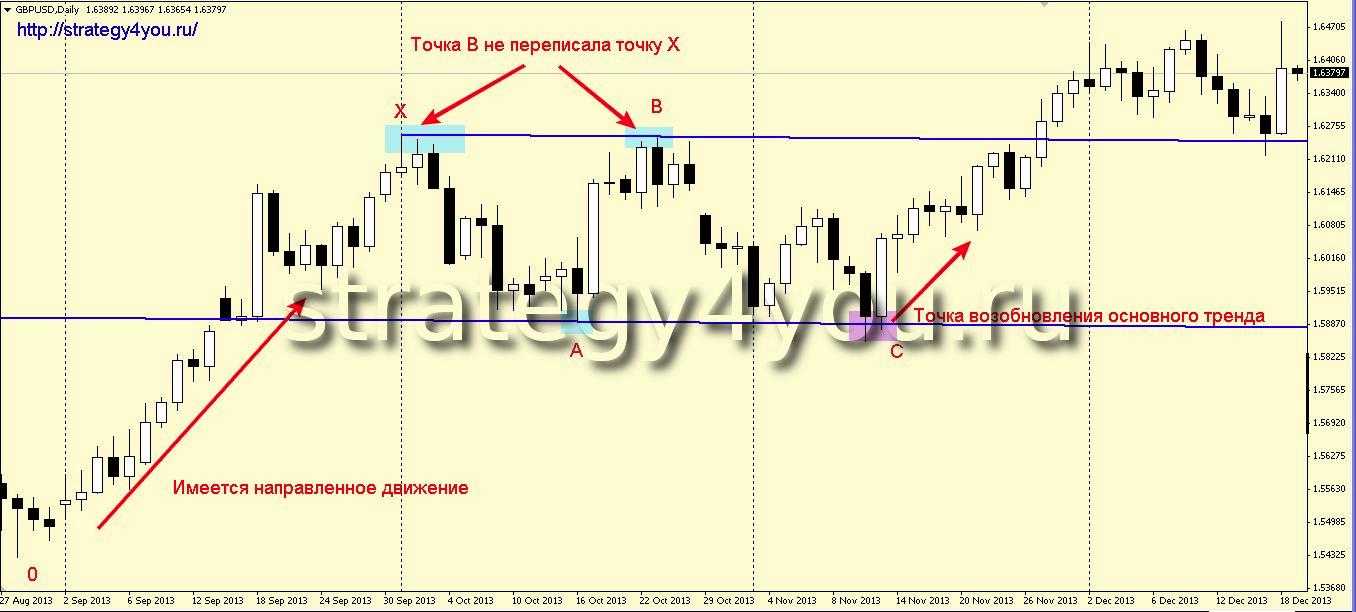
It is better to wait for confirmation of the clearing from point C:
- blast candle.
- reversal combination.
- breakout of the trend line for the B-C movement.
2. Search for additional signals at point C:
- important fibonacci levels of 38.2% or 61.8%.
- trend lines and channels.
The more additional signals, the more chances for a rebound at point C.
3. Of course, you should pay attention to the trend movement preceding the correction. If it is sharp, then perhaps we are dealing with the “Flag” pattern (the link is at the beginning of this article), which, in combination with the ABC combination, is an excellent signal and is described in some detail on this site.
Once again, I draw your attention to the fact that the main difference between the flag and ABC:
FLAG flagpole looks like a sharp movement (usually 1-2 candles and correction at the top or low (when flag down) of this flagpole in the form of a small flag) and often they appear after the news or important speeches of financial figures.
In the ABC model, the trend may not be very sharp and smoothly flow into a correction.
But the flag is more likely to work and get to the flagpole census!
4. If for some reason the entry to the market from point C was not made, then this can be done after the breakdown of the opposite side of the channel (X-B), where the price most often continues to move along the trend after testing from the opposite side.
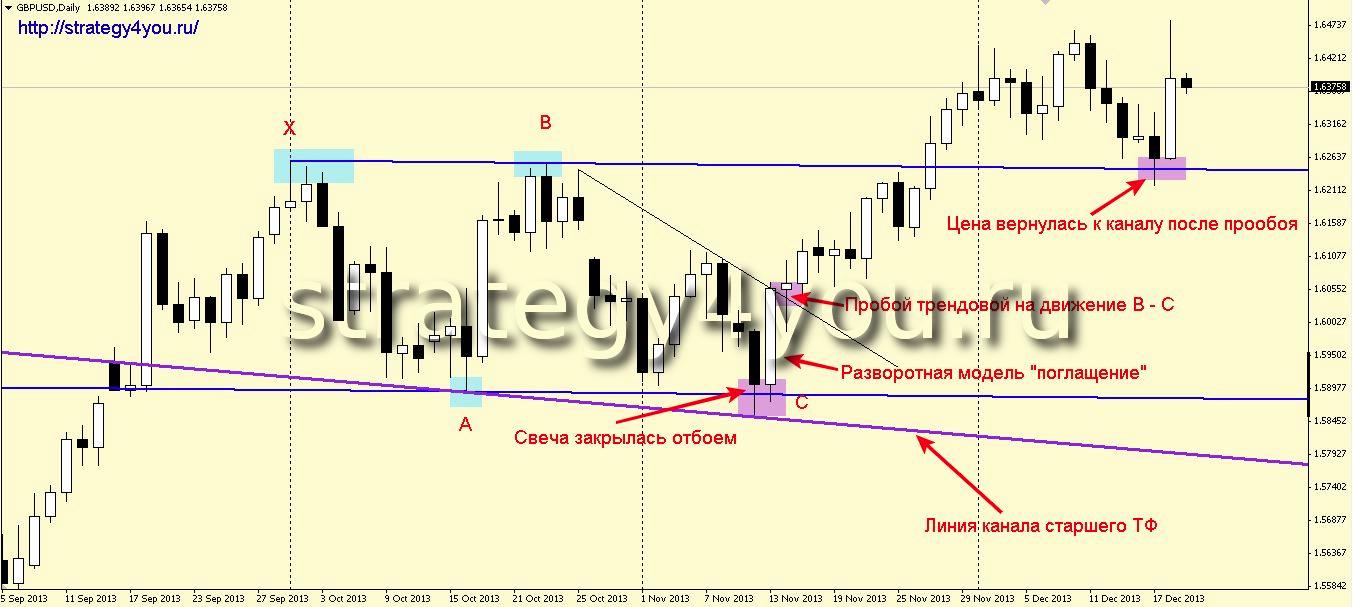
Target points for ABC take profit:
1. The most moderate option is profit taking when approaching the opposite side of the channel (X – B). At this level, it is at least definitely worth moving the stop loss to the level of opening a trade – to the breakeven level.
2. When entering from point C, the main target point is the census level of the first extremum (point X). You can also fix the main part of the transaction on it.
3. The target level can also be calculated by drawing a parallel line to the correction channel at a distance of the width of this very channel.
4. Fibonacci extensions can also be used.
5. The most distant target is the distance O – X, set aside from point C. However, it should be understood here that this goal is achieved less often and it is better to close the deal when reversal signals appear.
Stop Loss Setting:
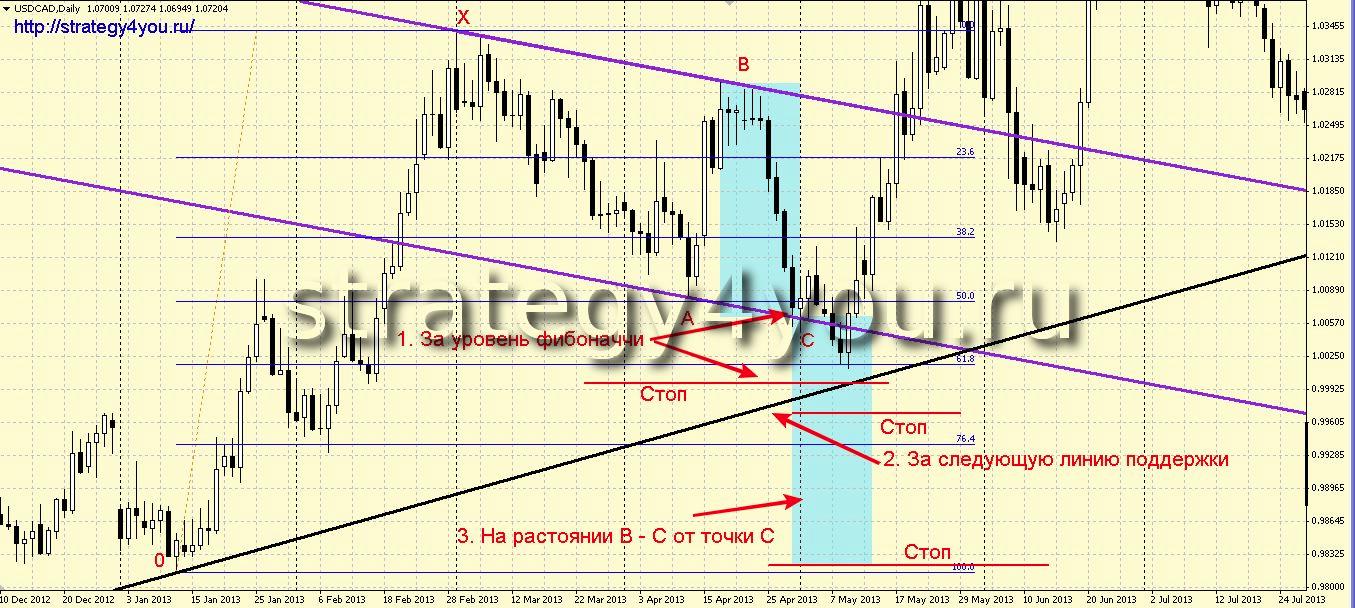
1. Stop can be set for the next Fibonacci level stretched by the previous trend correction.
2. You can also place it behind the nearest resistance/support level.
3. Alternatively, you can use a fixed stop in the size of wave X – A.
Additions to the considered graphical model:
1. Very often, this model is formed in close proximity to important resistance/support levels, which indicates that the price is gaining strength to break through it.
2. The ABC combination develops according to a similar scenario of reversal patterns: a double bottom (top) or a failed swing. It is for this reason that in the event of a breakdown of point C, one should look for exit points from the market without waiting for the stop loss to work.
3. If, after the breakdown of point C, the price will soon return to the channel, we will get a good signal to re-enter the market in the direction of the main trend.
Video on the ABC pattern:
And Video 2:
I don’t attach any MT4 templates and indicators, since this is a graphical model and you need to look for it on the chart yourself.