Forex Strategy «Weighted Taylor» — «Weighed Taylor» is based on the use of weighted moving average (WMA) and was designed to trade only on the daily charts, and originally for the currency pair EURUSD. Therefore, you should use it to trade at time intervals of less than D1, but if you do not fit in a given interval, and you wish to trade on smaller time frames — you should analyze the behavior of this forex strategy at intervals that are suitable for you and may make additional changes to the configuration of indicators.
Also, if you think that the size of your deposit forex is not large enough to trade on the daily range — I advise to use for this smaller size of transactions (eg 0.01 lot) or cent from forex.
Strategy Forex «Weighted Taylor» — «Weighed Taylor» is based on 3 main indicators forex (all of them are present by default in MT4), which interact together to give traders all the necessary information for a profitable trade:
- We will use the 5 weighted moving average (WMA), which provide an excellent visual representation of what the current situation in the foreign exchange market.
- chart RSI indicator helps to make the right decisions.
- Finally, for the inputs and outputs to / from the market, we use the MACD indicator (MACD).
For the weighted moving average (Linear Weighted Moving Average) should use the following settings:
- Method MA — Linear Weighted, period moving average:
- 5 color blue
- 15 color orange
- 30 color yellow
- 60 color pink
- 90 color red
- Indicator RSI — Period 13, set the level 2 (red) — 60 and 40.
- MACD indicator (MACD):
- Fast Moving Average — EMA 5, Slow Average — EMA13
- MACD-Simple Moving Average SMA 1.
- As it is necessary to install level 2 (red) — 0.005 and -0.005.
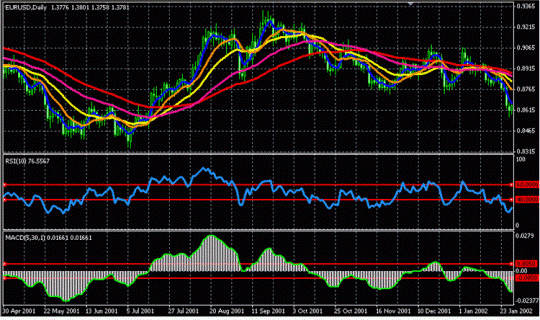
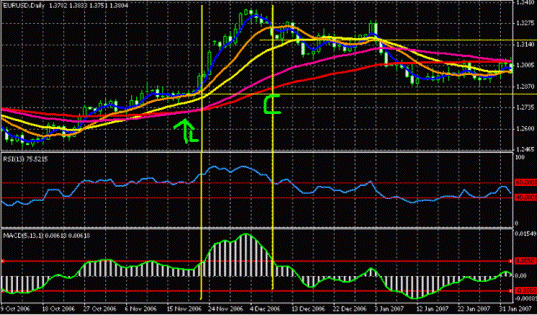
About the schedule should look like this, after all installations:
Figure 1
Conclusion of the transaction on forex strategy «Weighted Taylor»:
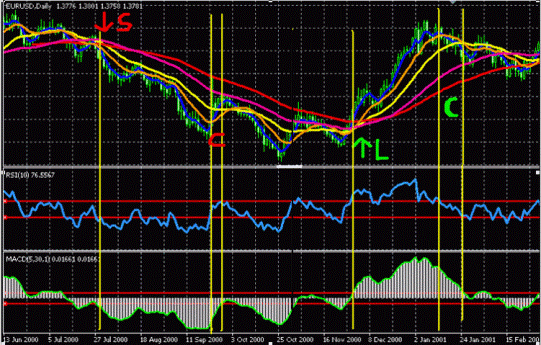
In Figure 2, you can see the two prisoners of the transaction. And although their conclusions are needed sufficient amount of time, but remember that earned income is worth it to wait just a profitable trade, and not lose their funds on deposit in forex, and then a very long time to recover it.
— 5 Moving Averages
Moving averages provide a visual representation of what is happening at this moment in the foreign exchange market. The logic of their application is based on the intersection of short-term MA means to open up a trading position.
— RSI indicator
Now look at the chart with the indicator of RSI. The logic of this indicator forex is known to all and is simple enough. Conducted two horizontal lines at levels 60 and 40. Between these specified lines we do not sell, because as soon as forex indicator is located in this zone, the currency market is usually a lot of noise and very little stable trends, allowing to take their pips profit. This position indicator forex also says that the foreign exchange market has no clearly defined trend. Of course, you can trade between these levels, but I would not recommend to do it.
Once the forex indicator RSI goes for the redistribution of the red zone, which was formed by 2 red levels 60 and 40, it indicates to us the possibility of further development of the market trend — and from this it follows that we must be ready to deal. As soon as the RSI breaks its top line and moves upward, it indicates an uptrend, if the indicator forex knocks down their level and moving down the same way, it points us to trend downward.
— Indicator MACD (MACD)
Setting indicator MACD 5,13,1. This forex indicator will be useful to us for the conclusion of a good entry into the market and the implementation of the exit. Also note that once the columns of the histogram are located within the «red zone» — not to be traded. The reason is exactly the same as for the indicator forex RSI. Zone, which limited the levels of red, is used to filter noise in the market. As soon as the column indicator forex MACD breaks up the red level — it is a signal for the opening of trading positions on the purchase, but as soon as the column indicator MACD breaks down his red level, it says that you should open a trading position on the sale.
Unified by all together:
Let us consider the first trade transaction, as shown in figure number 2. We have opened trading position on the sale. As seen in the upper price chart, the blue line is the bottom, it is for the orange and yellow moving average, which are also at odds with pink and red high. At the same time on the chart the RSI indicator light struck down a red level and directed downward, indicating that the formation of a downward price trend. At the same time on the chart MACD indicator, columns, struck the red level and directed the same way down, it just confirms the previous trading signals and a signal at the entrance to the market. Therefore, it is here we conclude the bargain.
Now, when our trading position is open, let’s answer the question, when will need to close it? As already mentioned — all schedules are used to identify entrances and exits from the market. Let’s look at the information that gives us a point of exit from the market. In this case shows two possible exit from the market. Blue Line RSI indicator starts to move upwards. Then line the RSI indicator returns to its «red zone», finally the MACD indicator is also returned to their «red zone». This is where the need to close our bargain.
Figure 2
Now let’s analyze the 2 nd of sale transaction. On the possibility of concluding a long trading position indicates, firstly, the blue moving average, which is located on top, followed by orange and yellow moving averages, which are also at odds with pink and red moving average. At the same time the index indicator forex RSI broke its red level up and moves upward, the columns of the MACD indicator broke through his red level and move just the top. In this case also, there are 2 possibilities, where you can close our open bargain. Reasons for closure as it follows: the RSI is returned to the area bounded by its red with 2 levels, but by that time the MACD indicator is still beyond their levels. In 2-m option is out of the deal can be done as soon as the MACD indicator bars punched his red level.
Let’s just analyze a few simple examples so you learn to identify patterns for transactions and out of them.
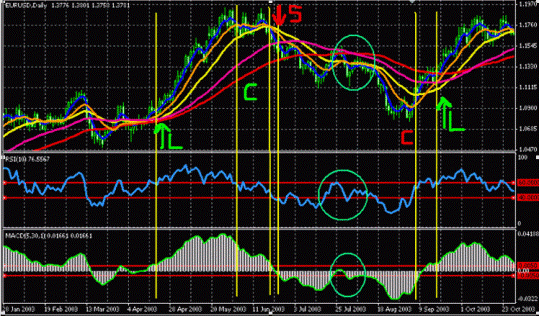
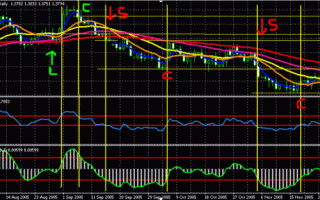
Figure 3. 1-I bargain — the opening of trading positions on a purchase. Should pay attention to the fact that the blue moving average located at the top, followed by the same followed by orange and yellow is average. And while they disagree with the pink and red high. At the same time RSI breaks up the red level, as well as the MACD indicator. Ie at the same point on the graph converge all three trading signal for the opening of trading positions on a purchase. And just like in the previous 2 cases, there is the same 2 options for closing an open transaction. 1-I vertical level coincides with the return of the RSI indicator in its «red zone», 2 nd same vertical line coincides with the return to their «red zone» indicator MACD.
Figure 3
We continue to explore the figure 3. 2-I have a bargain — a short trading position, but let’s once again a closer look at the trading signals. Although the blue moving average is not located on the bottom, blue and yellow moving average broke through the pink, which already indicates the main trend reversal on the daily chart. And secondly, the RSI has struck down the red level and moves downward as well, and the column indicator MACD also broke his red level down.
Let’s look into zones that are circled. In these areas the RSI and MACD indicator is returned to its red border, which are marked red levels, but why were not close a position at this point? So the reason for this is to move our set of moving averages: the average is not pierced orange yellow middle, while the pink middle is still going down, almost without suffering the influence of the spike up in the chart. Output is from a trading position at the point where that is shown by the letter C.
Well, now let’s look at the latest bargain in Figure 3.
We open a trading position to buy when the blue and orange moving average struck up a pink and red moving average. At the same time the RSI broke up his red level and moves in an uptrend, the same as we have seen in the histogram and the MACD indicator.
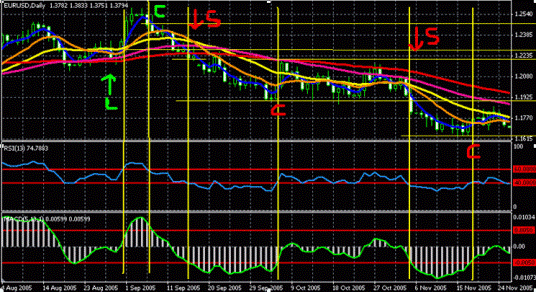
Well, now let’s analyze the transaction in Figure 4.
1-I long bargain is formed as soon as AI is blue on top, the RSI breaks up his red level at the time as an indicator MACD also breaks his red level up. Closure of an open transaction occurs at the point C, as soon as the RSI and MACD indicators return to their «red zone». The conclusion of the next trading «short» transaction shown in the place where the average is blue on the bottom, but the RSI and MACD indicator is punched down his red levels and moving down as well. Closure of the bargain is made, as only indicators RSI and MACD back again the same in their «red zone». The latter deal in the figure 4 — is a short trading position. All the conditions for open positions were carried out — the blue line on the bottom, the RSI breaks down his red level indicator MACD breaks the red level as down. Closing of the transaction occurs as soon as the RSI and MACD indicators are returning to their «red zone».
Figure 4
Yellow horizontal levels on the charts give you a chance to see how many points you can earn profits on each open transaction.
In Figure 5 we see a bargain, which earned 200 points in three trading weeks!
Figure 5
I hope that the description of forex strategy «weighted Taylor» It was very easy to understand and it does not require much effort to implement in your trading account!

