Indicator Ishimoku (Ichimoku Kinko Hyo), or as it is called «equilibrium chart» to determine on Forex market trades with a high probability of profit, and the cloud Ishimoku serves as a filter of information chaos.
- The trading terminal Metatrader 4, the indicator forex called Ichimoku Kinko Hyo.
This type of trade is still poorly familiar with the basic mass of traders, but its popularity is growing. Effectiveness indicator forex Ishimoku confirmed multiple tests on the forex market, it combines three indicators forex at one price schedule, which ultimately gives us a ready-trading system that does not require any more forex indicators and allows the trader to make the right decision at the conclusion of the transaction, as trader becomes more informed, applying it.
Introduction to Ishimoku
This indicator forex describes the behavior of prices in the market from different angles, creating the possibility of finding a deal with a high probability of success. Although many traders FOREX this indicator tends to scare the abundance of «any» lines on the chart, but the components of the indicator forex can be easily translated into a much more familiar form.
And so Ichimoku indicator consists of 4 main components to help Forex traders understand the behavior of prices in the currency market forex.
Let’s look at the line and Tenkan Kijun Sen. They represent a nothing more than a 20-and 50-day moving averages, albeit with a slightly different time scales.
1. Line Tenkan Sen — represents the sum of the highest high and lowest low on the chart, divided by two. Line Tenkan Sen is calculated over the previous 7.8 candles on the chart.
2. Line Kijun Sen — also represents the sum of the highest high and lowest low in the graph divided by two, but the line Kijun calculated for the last 22 candles on the chart.
To open a trading position in the chosen currency pair, the trader is looking for the intersection of these lines — which is similar to moving average (Moving Averages).
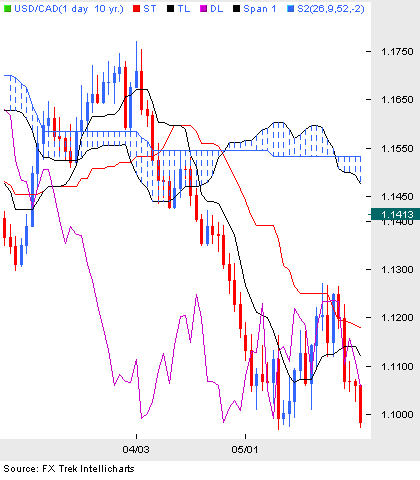
In Figure 1 we see a clear crossing of the line Tenkan Sen (black line on the chart) and the line Kijun Sen (red line on the graph) at a point defined as the «X». This signal tells us that the price will soon fall down.
Figure 1 — The intersection of lines Ishimoku
And now propose to consider the most important component of the indicator Ishimoku — is «cloud», which represents a current and historical behavior of prices in the market. Ichimoku cloud behaves almost exactly the same as a simple line of support and resistance, creating a barrier.
Ichimoku cloud is formed of two main components:
3. Line Senkou Span A — calculated as the sum of lines Tenkan Sen and Kijun Sen, divided by two. No account is taken 26 of last closed candles.
4. Line Senkou Span B — calculated as the sum of the highest peak on the graph and the lowest low divided by two at the same time. No account is taken over the past 44 closed and candles as they are shifted by 22 candles ahead of time.
The region between these lines is called Kumo or «cloud Ishimoku». Wide cloud Ishimoku gives the trader a very good filter. This cloud allows you to take into account the volatility of the currency pair on the market. Breakthrough price through a cloud Ishimoku and subsequent move above or below it, indicates the trader a better and more likely to bargain.
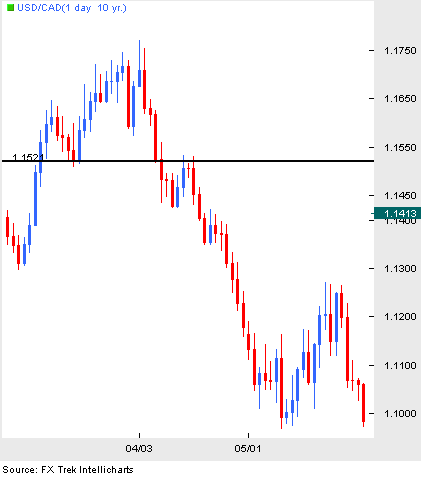
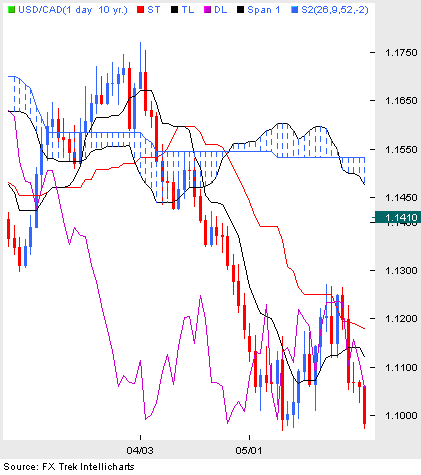
For examples, see Figures 2 and 3.
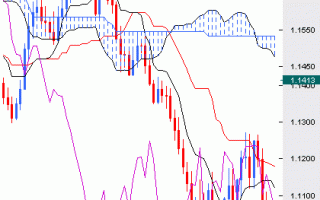
On the example of a currency pair USDCAD we see a tangible difference between the two price schedules. Although we observe a clear support level at 1.1522 familiar to us the price chart (see Figure 2), the price subsequently test this level again. At this point, some prisoners of the transaction can be knocked out of the market for stop-loss, because price pulls back in the opposite direction. But, as an example of an indicator Ishimoku (see Figure 3) cloud Ishimoku for us is an excellent filter. Taking into account the volatility in the market, the cloud Ishimoku gives a better opportunity to trade the break of 1.1450. In this case the price is not rolled back, while holding the bargain in the pulse of the downtrend.
Figure 2 — A classic breakout level of support and resistance levels
Figure 3 — Indicator Ishimoku gives the best opportunity for the application of a breakthrough
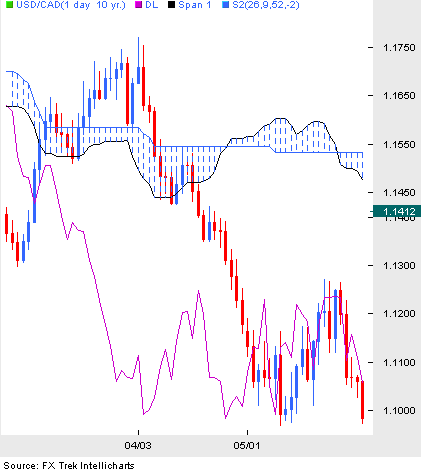
Finally, the last component of the indicator Ishimoku — Chikou Span. Displaying the mood in the currency market, Chikou a market price at closing, which is shifted at the same time for 22 periods ago. This characteristic indicates the sentiment of the forex market, while delivering the underlying trend in relation to the existing momentum at the moment prices. The essence is simple: if the foreign exchange market dominated by sellers, the line will be Chikou Span and fluctuate less than the price on the chart, and just the opposite — as when trading on the currency pair will lead buyers Chikou Span line rises above the price chart.
Figure 4 — line Chikou helps determine the foreign exchange market sentiment
Now let’s add it all together:
Let’s try to understand best way to trade using indicator Ishimoku — «cloud technique».
Figure 5 — The lines tell us everything
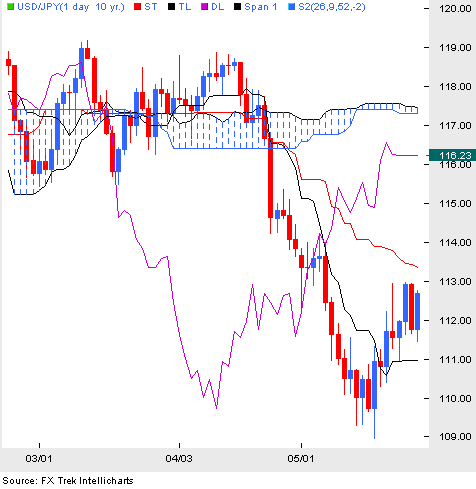
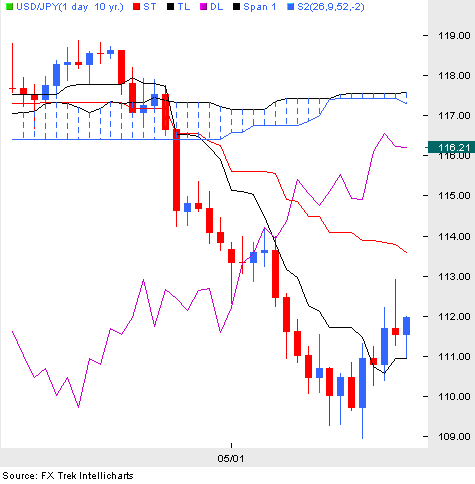
Consider an example — USDJPY in Figure 5 and slightly increased the scale of the image — as a result see Figure 6. From the beginning, the currency fluctuated within a price range between 116 and 119, and Forex traders awaited breakthrough in the market. During the whole time until the market traded sideways, Ichimoku cloud acted as a support level-resistance for the market price.
Having determined this, we turn to the lines and Tenkan Kijun Sen. And as mentioned earlier, these two indicator lines work like moving averages, where the line Tenkan represents a more short-term average, and the line Kijun — basic sliding line. In the end, as soon as the line falls below the Tenkan Kijun, we get a trading signal about a possible price drop on the market.
But as long as this intersection is in the cloud at point A in Figure 5, and therefore the signal is not unambiguous. To a trader could think about entering the market, the signal for the transaction must be located outside the Ichimoku cloud. We can confirm this downward trend in the market with Chikou Span, which at this point is below the price chart.
Conversely, if the line Chikou was higher than the price on the chart, it says to us, increase sentiment. Combining it all together — now we will look for an opportunity to open a trading position on the sale of our chosen currency pair.
Figure 6 — The entrance to the market is located just below the cloud Ishimoku.
Because we equate the cloud Ishimoku to support levels Lieb resistance, before opening any trading position to sell, we need to make sure that the closing of the trading session happened below the cloud Ishimoku. The result — open a position at point B on our price chart. In this case, we have confirmed breakthrough Ichimoku cloud at the level of support for 114.56.
Forex trader at a given point may decide to immediately open a trading position below the support level of 114.56, or the same place a pending order one point below the minimum trading session. Placement of a pending order one point below, will be an additional confirmation that the momentum in the market downward movement still persists.
After that, we will place a stop loss just above the maximum candle within Ichimoku cloud. In our case, it would be at point C, or at the level of 116.65. Price in the market should not trade above this level, if the momentum is still preserved. As a result, we have entrance into the market at a price of 114.22 and a safety stop-loss order at 116.65, while our risk is 243 points.
In accordance with the basic rules of money management shall establish the ratio of profit to risk at a rate of 2:1. Market price was down to its minimum 108.96, which is about 500 points, as it follows our considered the deal has brought a good profit.
But remember that the indicator Ishimoku usually applied to larger scale of time, in this case, the daily (D1).
Now repeat the study:
1. Intersection of lines and Kijun Tenkan — good help to identify potential price movement in the market (and acts like a moving average).
2. Confirmation of the trend with a line Chikou — make sure that the mood of the forex market for this currency pair corresponds to the intersection of lines and Kijun Tenkan — a significant increase the likelihood of concluding a profitable trade, as Chikou acts as a Momentum Indicator.
3. The price on the chart have to break through the cloud Ishimoku — that the trend in the market has become pronounced, the price necessary to break out of the clouds acting as resistance to support. This will greatly increase the likelihood of concluding a profitable trade.
4. With a deal — follow the rules of money management (the risk of a deal should always be at least 2, or even more times less desired profit).
Relatively little strange, and immediately obscure indicator forex Ishimoku if it is well to study, can be very useful for any trader forex — from beginner to the professional trader.

