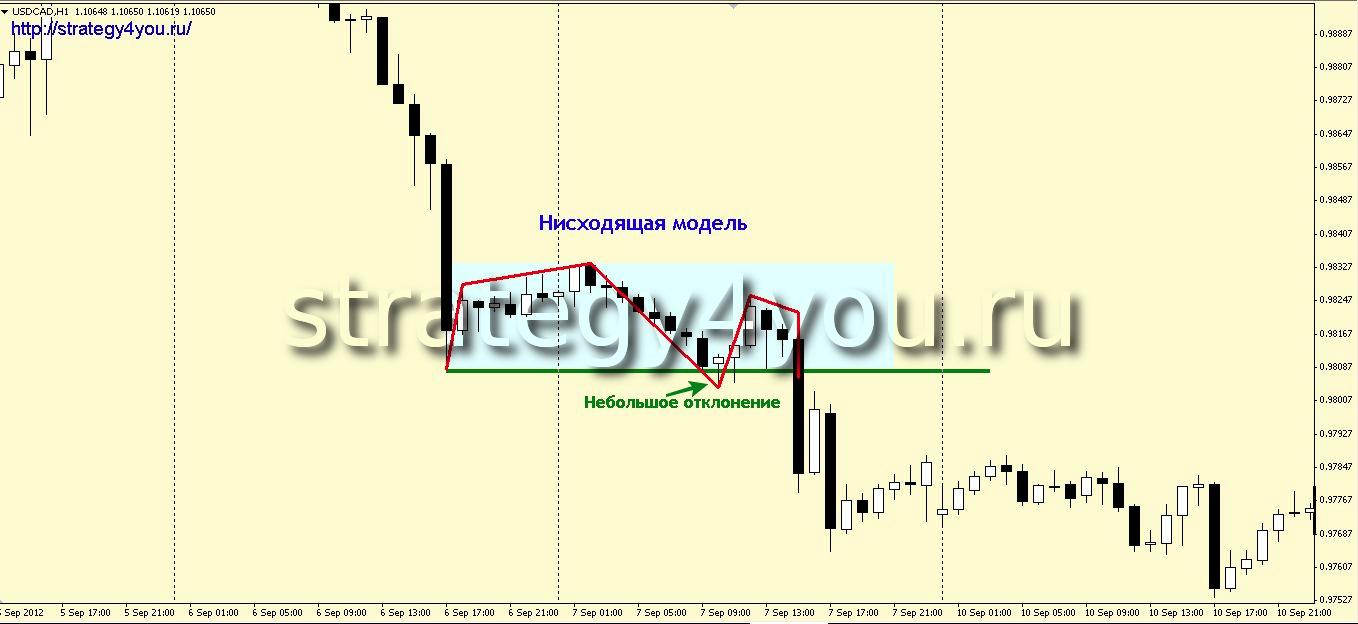
The “Cup and Handle” pattern is a model of the continuation of an exclusively uptrend, but taking into account the fact that the concept of a trend in the currency market is rather relative (for the EUR/USD pair, a downtrend is bullish for the dollar), we can consider this pattern on Forex in both directions. sides.
This model, as well as many other graphic patterns in principle, works on all financial instruments, although it was originally intended for the securities market.
You already know that when trading on Forex according to the rules of graphical analysis, a special place is occupied by various price models – patterns that periodically form on the chart and, accordingly, indicate a possible continuation of the trend, uncertainty or a reversal. By and large, these are the patterns of price behavior noticed and highlighted throughout the history of exchange trading by the trading community.
Now let’s take a closer look at the chart pattern or Cup and Handle pattern.
This model was first described in his book “How to make money in stocks – A winning system in good times and bad” by financial guru William O’Neill. The description of this model is very often found on various information resources. However, it is almost impossible to find any information about the conditions for trading this pattern. Based on my personal observations, I can say that anyway, even in the currency market, “Cup with a handle” is much less common on a downward movement, and very often it is formed with large deviations (not ideal).
As for the time interval, everything is the same as with other models – it is better to consider it on the daily chart, but if you go down to smaller timeframes, then certainly not lower than the hourly interval.
Description of the model “Cup with handle”
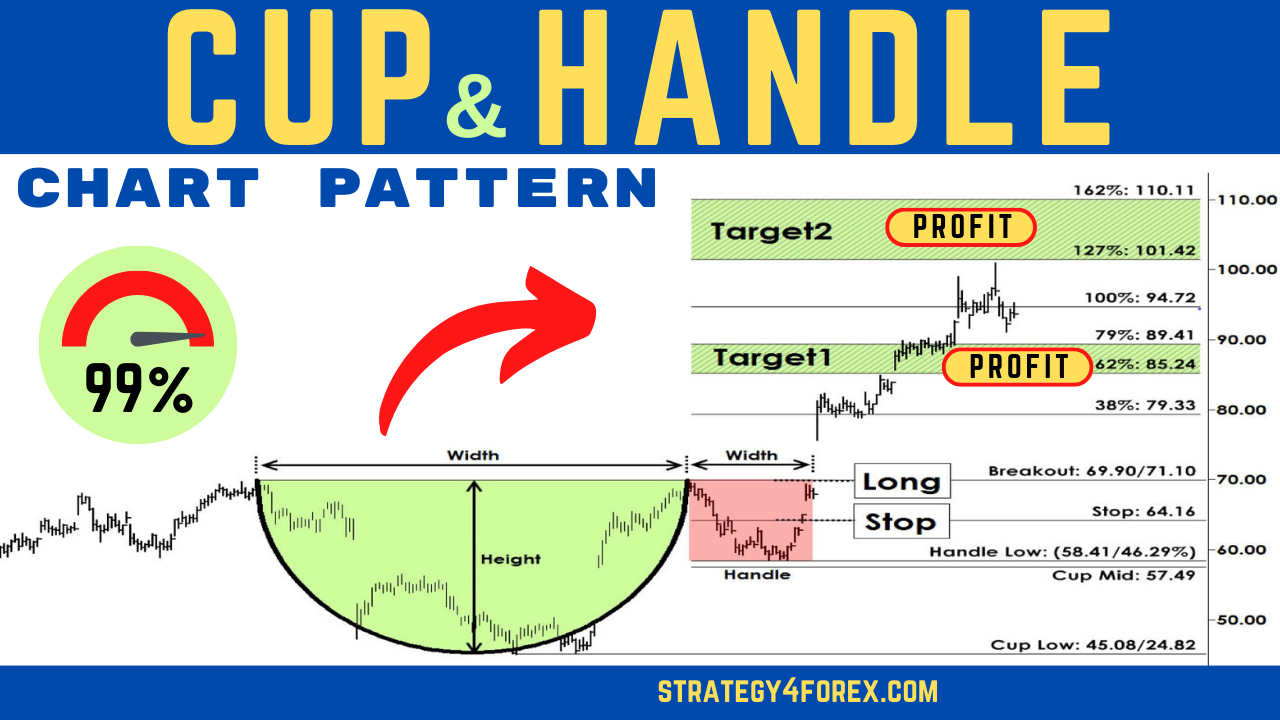
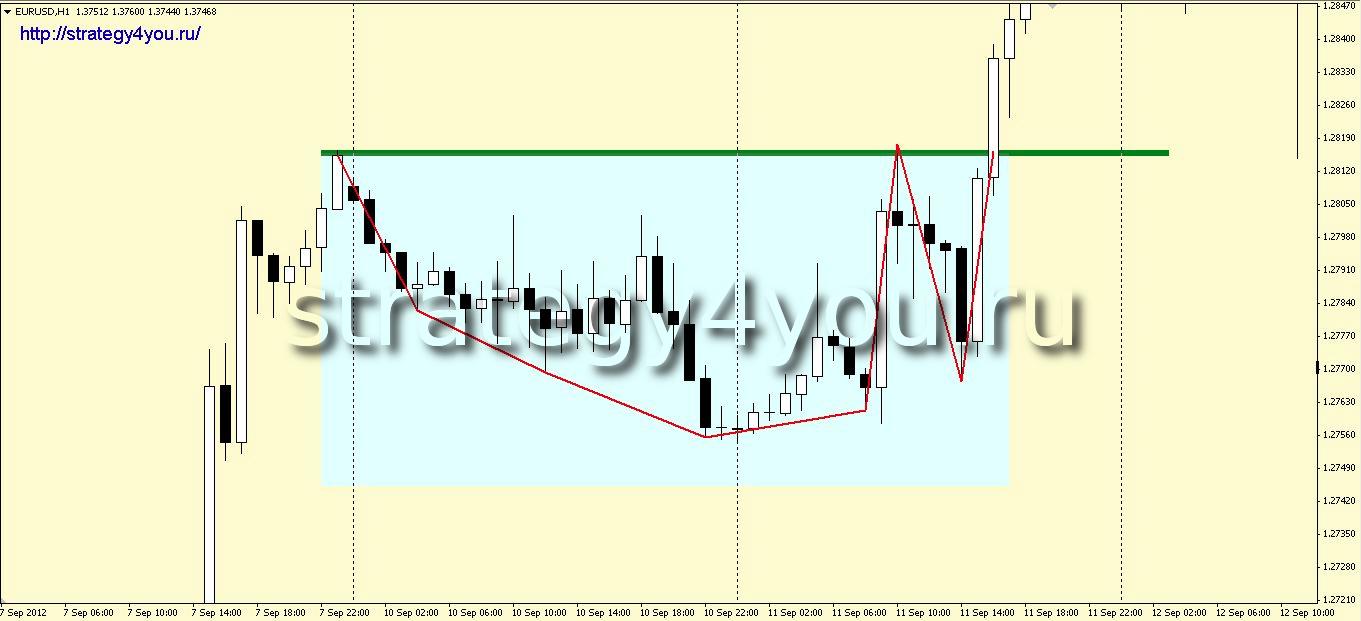
Since the Cup and Handle pattern is a trend continuation pattern, the fundamental condition is the presence of a previous trend. After the formation of the next maximum (point A), a correction begins, which proceeds in an arcuate manner, that is, the price smoothly falls and just as smoothly returns to the level of the previous extremum (point B) – a cup. This correction should not fall below the 61.8 fibonacci level from the entire previous main trend.
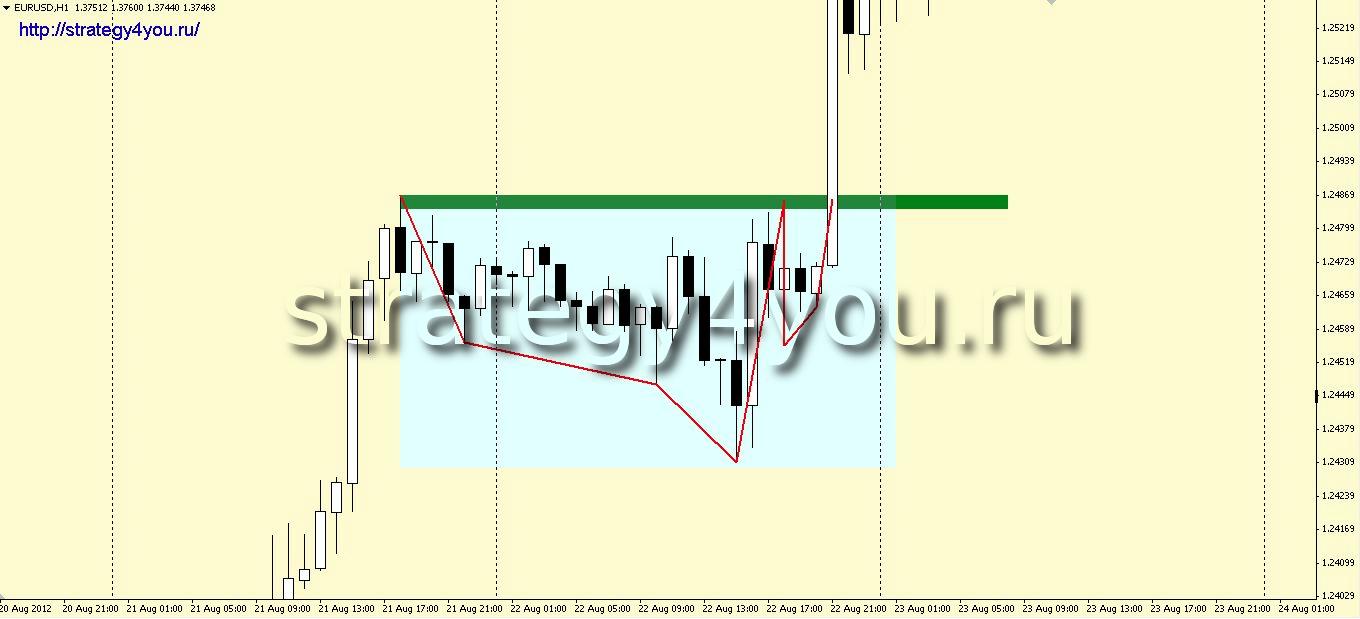
The price fails to break through this resistance from a swoop and the next rollback (handle) begins, but already in smaller sizes than the previous one (cup) – consolidation before the breakdown. As for the second pullback… Ideally, it should be within 1/3 of the price range of the cup, but there are models with a handle size reaching up to 61.8 of the upward movement inside the cup. If the price rolls back even further, then the pattern is considered invalid.
Regarding the time of the formation of the handle, it should be said that it should not exceed 1/3 of the time of the formation of the cup.
Entering the market according to the “Cup and handle” model
Aggressive. As soon as we notice that the handle has almost formed, we place a breakout order higher by a few points of point B. The downside of this method is that we can run into a false breakout, since we do not wait for the breakout to be confirmed. In this case, if the current candle does not close above the resistance level from point A, you should immediately exit the market.

Moderate (classic). We conclude a deal to buy immediately after the breakdown of the resistance level from point A. Be sure to close the candle of your chosen time interval to confirm the breakdown. The disadvantage of this method is that the price sometimes goes too far.
Conservative. After the price has moved above the resistance level from point A, we place a buy limit order from the broken level. This method, of course, is also not always justified, since the price does not always return at the same time interval to testing the level and you can stay out of the market.
Stop Loss:
A safety stop-loss order is set below the minimum of the handle. Of course, you can also consider setting at an even smaller distance, for example, beyond the 50 fibonacci level from the upward movement inside the handle, but this is at your discretion.
Target levels:
The main target level is the cup height from the breakout point. It should be noted that this level can be reached for quite a long time.
The secondary level of profit fixation is the size of the entire pattern preceding this model, but it will take much more time to achieve this goal.
It should also be said that the model in which the lowest point (bottom) of the cup is at the fibonacci level of 50 from the entire main previous trend has more chances for a successful outcome, since it can also be considered as a “Measured move” model and the fact of the presence of two patterns in one price model has a very positive effect on the results.
In conclusion, I will say that this pattern does not appear on the market very often, but if a trader has the ability to wait and take his time, it can significantly facilitate the trading process. And not only in pattern trading, but also when analyzing the current situation on the market.
![CUP with HANDLE Pattern [Forex & Crypto Trading Strategy]](https://strategy4forex.com/wp-content/cache/thumb/91/4d0031b90d52491_320x200.png)