Dear traders, today I bring to your attention an article with a study of the Flag pattern.
On this site, we have already considered the “Flag + ABC” pattern, and I personally consider it just an ideal Forex strategy for making a profit (I myself started making Forex on it, and to this day it brings me profit)!
And now research on the forex pattern under consideration
I want to say right away that I don’t correct anything in the article and send it as the author provided, I just added a few links in the text from this site:
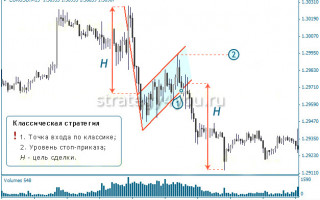
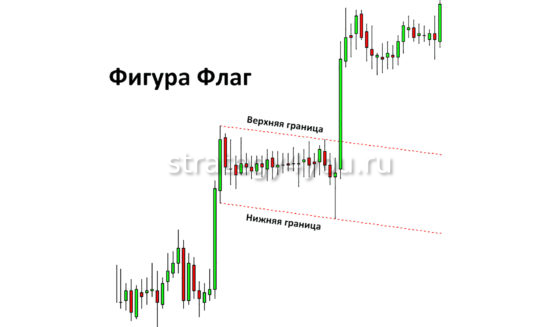
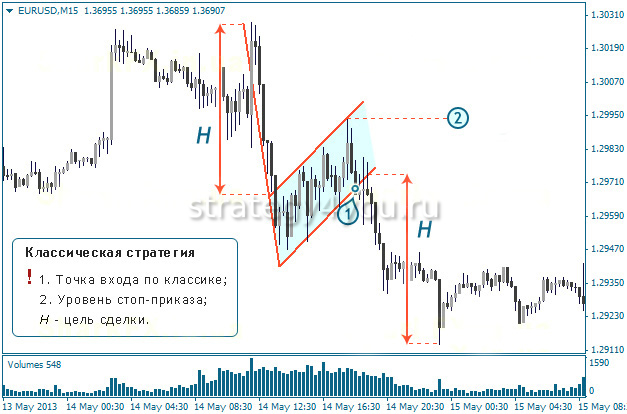
Everyone knows that the “Flag” pattern is considered a trend continuation pattern, that is, the classic version is an entry after the breakdown of the upper line of the correction channel with the following goals:
1) correction value,
2) the size of the flagpole from the breakdown point (Fig. 1)
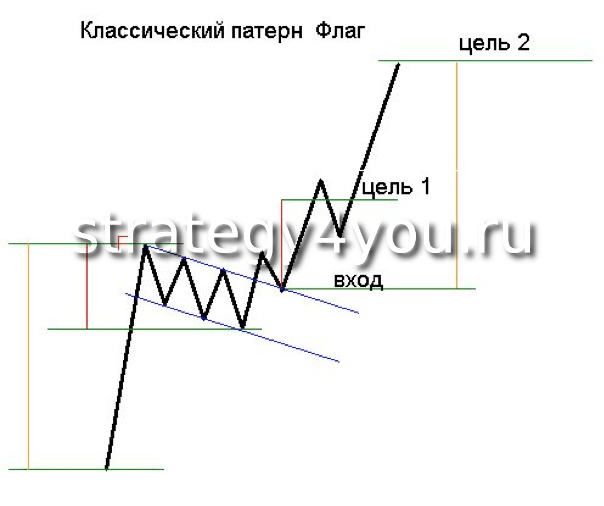
pic.1 – Classic pattern “Flag”
Trader and analyst Alexey Loboda proposed to combine the “flag” pattern with an ABC-type corrective movement (Fig. 2a). And also, to find an earlier entry point, he imposed the Fibonacci lines on the flagpole (Fig. 2b), and for the first target he took the flagpole maximum from the entry point (Fig. 2c), the second target from the same point was the pending size of the flagpole.
Thus, this pattern has gained stability and a clearer description and guidance for action, and the likelihood of a favorable outcome has increased significantly.
- But still, in the process of getting to know this pattern, questions often arise: is it a flag or just aws?
- When to transfer to breakeven?
- Should all profits be fixed at point one or part, etc.?
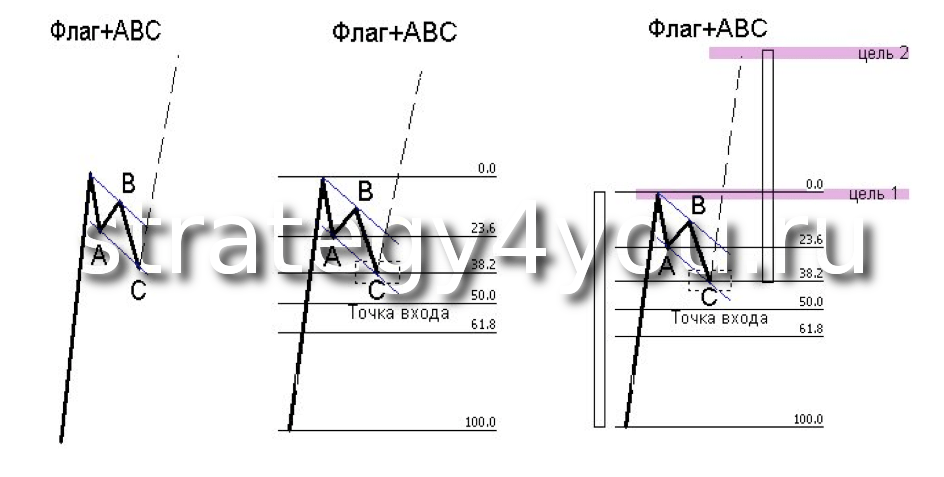
fig. 2a . . . . fig. 2b . . . . fig. 2c
It was for this reason that it was decided to analyze this model in more detail and try to determine the main components of the ideal Flag + ABC model, both graphic and temporal.
For a long time, a large number of variants of this pattern were collected and analyzed using various tools and at different time intervals. The most significant and interesting observations will be presented in this article.
Graphic components of an ideal flag
1) After the formation of the flagpole (a sharp impulse movement “F”), a rollback occurs, forming a point “A”, preferably to some fibonacci level (23.6, 38.2, 50; the level of 61.8 is not considered, because further formation of the flag is not possible) from the entire flagpole (the entire impulsive movement).
From point “F” to point “A” we stretch the fibonacci levels (Fig. 3), point “B” should be located in the range from 61.8 to 76.4 fibonacci “F-A” (the closer to 76.4 the better) .
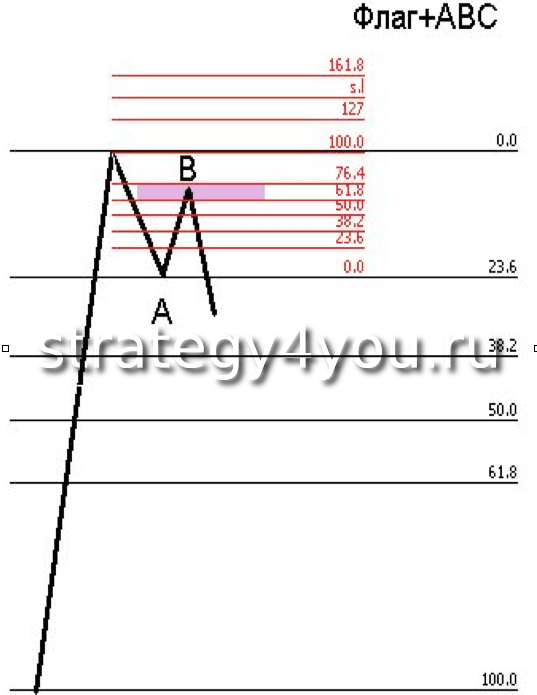
fig. 3
2) Ideally, point “C” is located at the intersection of the correction channel and the fibonacci level from the flagpole, following the level at which point “A” was formed. An additional confirmation can be the fibonacci extension stretched from “A” to “B”, most often this is the level of 161.8 “A-B” (Fig. 4).
3) At the points “F”, “A”, “B” we install the Andrews pitchfork (Fig. 5). Movement from point “B” to point “C” should not go beyond the beam from point “B”. The intersection of the central beam of the Andrews pitchfork (from point “F”), the fibonacci level from the entire flagpole (following the rebound level of point “A”) and the channel line, is an ideal point for placing a limit order.
After the breakout of the Andrews ray from point “B” and its re-test (occurs in most cases, but can occur at the lowest of the considered time interval), the deal can be transferred to the breakeven level.
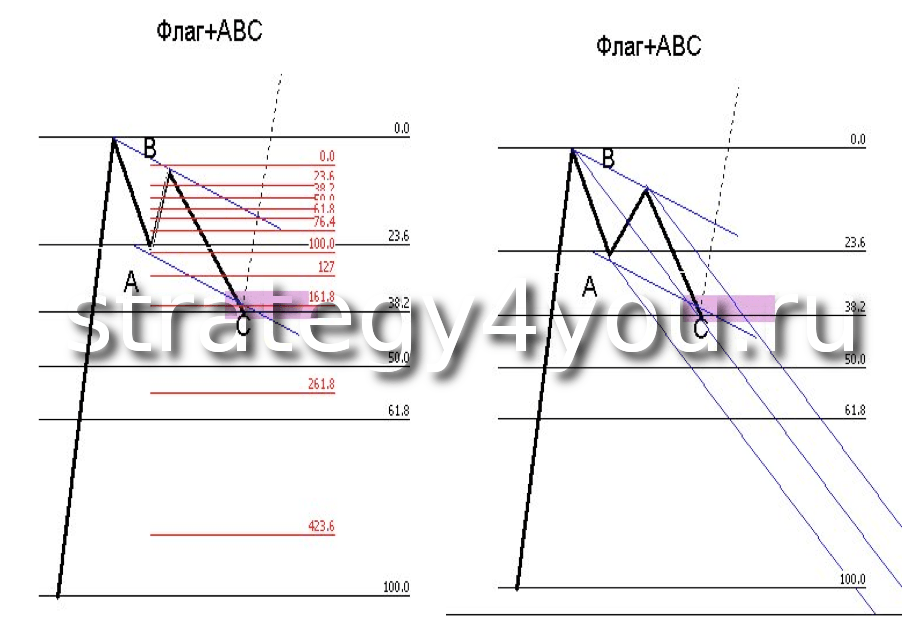
fig. 4 . . . . . . . fig. 5
Temporal equality in the “Flag” pattern
Wave F-A should be greater than or equal to wave B-C, and wave C-D less than or equal to wave A-B, where D is the point at which the opposite line of the correction channel is reached.
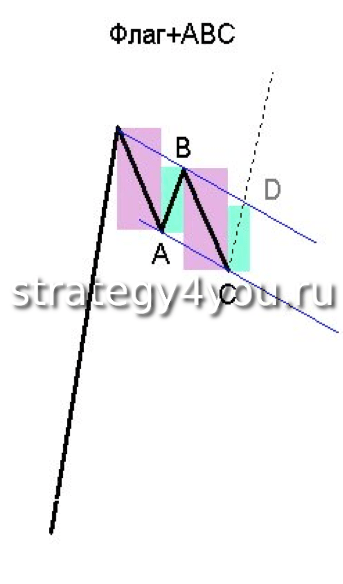
fig. 6
For convenience, we plot two rectangles of different colors on the graph, each of which is equal in width to a wavelength. The first is equal to the “F-A” wave, the second “A-B” wave (Fig. 6). After that, we project these rectangles onto the chart immediately from point “B”.
The rebound is ideally expected at the border of the third and fourth rectangle, but during the fourth phase the rebound is acceptable.
If during the rebound the price goes beyond the boundaries of the fourth rectangle, and the opposite line of the correction channel is not reached, the transaction should at least be transferred to the breakeven level, and from the point of view of safe trading, profit should be fixed, because. the figure can be called “violated” and the probability of reaching the goal decreases sharply.
Other observations by pattern
After a detailed study of the pattern, the following conclusions were drawn:
- the percentage of achievement of the first goal is approaching 90%
- the percentage of direct achievement (without a return and without protracted corrections) of the second goal is approximately 25% (we are talking about goal number 2, and not continuing to move).
- the percentage of achieving the second goal increases (55%) if there is an additional signal at point “C” according to graphical analysis, which is not related to the development of this pattern.
- the probability of reaching the second target is higher for the patterns whose entry point is located at the 23.6 fibonacci level stretched to the flagpole.
- the deeper the correction, the less likely it is to work out the second target.
- the sharper the movement from point “B” to point “C”, the more impulsive is the rebound from point “C”.
Pattern psychology
I would like to speak about the psychology of the emergence of the pattern. From my point of view, the following is happening: after the impulse movement caused by a powerful push in a relatively calm market, players who were in indecision and uncertainty, out of fear of missing out on the mass movement, enter the market in the direction of the impulse.
At the target level, those who entered first begin to take profits, and for this reason a rollback begins, during which the mass of those who entered later, fearing a rebound and missing out on any profit, also begin to be fixed.
Then, the players who remained aside, who missed the beginning of the movement and did not want to enter along the way, having waited for a small rollback, begin to enter the market in the direction of the first impulse movement, thereby forming wave “B”.
But their strength is not enough for the census of the extremum, because. players who did not have time to take profits at the peak of the flagpole and those who did not want to fix on less favorable conditions, having seen a favorable development of events for themselves, out of fear of “stepping on a rake a second time”, begin to take profits, which frightens those who entered at the level of the first rollback and pushes them to close their positions , they are also joined by those who “recognized” a reversal movement in this combination.
Thus, the price smoothly reaches point “C”, from where our main “heroes” of whose actions served to start the entire impulse movement, having waited for favorable conditions for themselves and seeing space for movement to the flagpole extremum, they enter the market in the direction of the flagpole.
Conclusion
In conclusion, I would like to summarize the work done. A detailed analysis showed that with the right approach, this pattern has a high chance of making a profit. The study outlined and made it possible to receive additional signals for actions both at the entrance and in the development of events after the entrance.
I also concluded that in most cases it is better to close the deal completely when reaching the target point No. 1, and to close partially and aim at point No. 2 makes sense if there are additional signals obtained by graphical analysis regardless of this pattern.
I hope that this article will help you better understand the structure of this pattern, identify it in time and give you confidence when making a decision to enter or ignore an incorrectly recognized pattern, and most importantly, help you save and gradually increase your deposit.
P.S.
In this study, a large number of different graphical tools available in the MT4 trading terminal were used, but no more particularly important patterns were recorded (including the dependence of the ideal model on the degree of inclination of all waves and various angles of inclination at a scale of 1: 1, where only that the angle of the flagpole should preferably be within (for bullish) 83-90 degrees, (for bearish) 270-277, but this is more likely for those who encounter this pattern for the first time).

Also, at the moment, we are only studying the development of a pattern that has a flagpole on a longer time interval, and the correction takes on the shape of ABC on the lower time interval, since there is an assumption that if there is an impulsive movement, then the subsequent correction may not have time to manifest itself on this the same interval due to high volatility (which has a very positive effect on the development of the pattern) at the moment, and ABC can be recognized on an interval of less.
At this stage, the results are positive, but data processing is not yet complete and current results should not be relied upon.
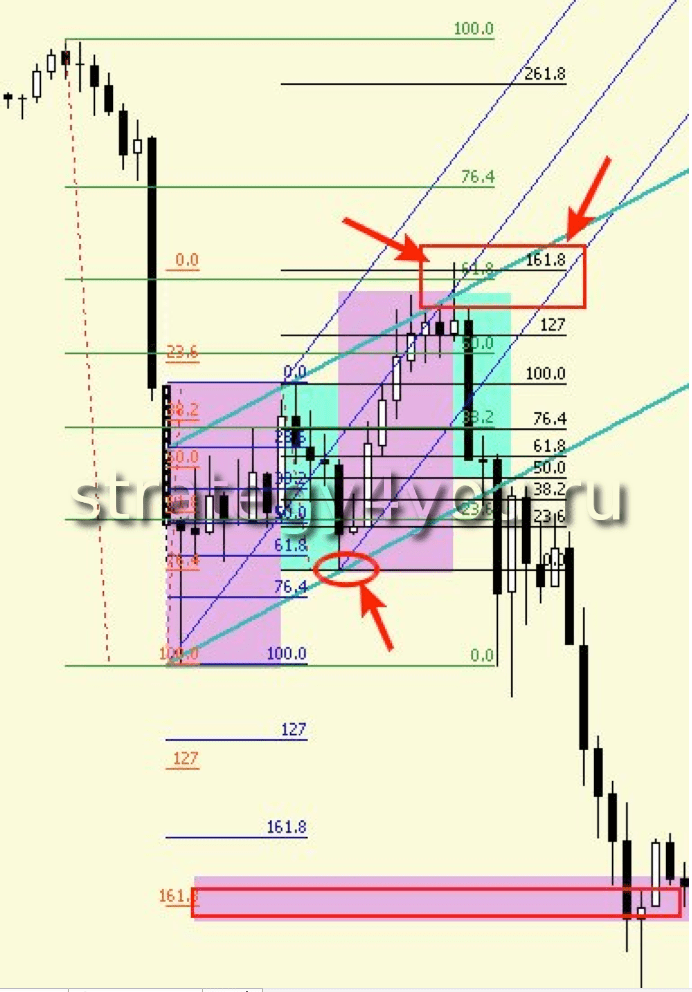
(in the figure below, the time interval is reduced for clarity, for this reason the flagpole does not look ideal)