Parallel channels — one of the most common chart patterns in Forex & Crypto charts.
They give the traders an excellent opportunity for a living, regardless of whether the market is now trending or non-trending state, as well as in what time period you are trading.
Algorithm forex strategy «parallel channels:
Horizontal channels are known as «trading range» or «consolidation» — in cases where the foreign exchange market is no trend (purposeful movement up or down). Uplinks appear on the charts, when the market is moving steadily upward, downward channels are in a downtrend. No matter in what market conditions are now the market is — there are always parallel channels in a variety of shapes and sizes.
Consider this example:
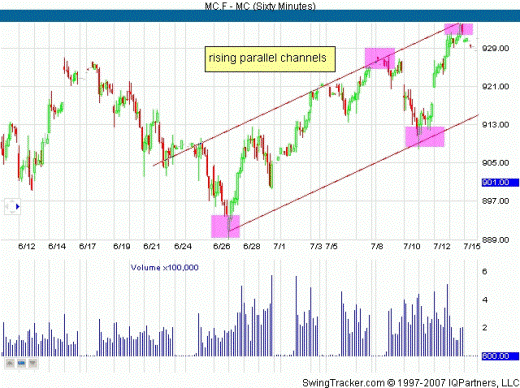
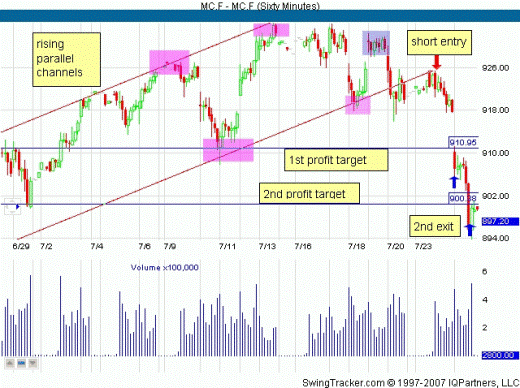
In the range from mid-June to early July 2007 futures S & P 400 MidCap E-mini move in the price chart in the uplink, as you can see at the bottom of the hour presented a chart. And although the MidCap and remained near its record high price, it is still trading in a large trading range. Parallel channel gives us a glimpse of part of the lateral motion.
Figure 1
Parallel channels can be defined as soon as we find two top and two bottom of (they are marked with purple rectangles on the chart). As soon as we could find such a channel, we can use the following trading strategy: we must wait until the price on the chart close to the upper or lower trend line and determine the setup.
At this point there are two options:
1. Price tends to push the boundaries of concurrent channels and go in the opposite direction it up or down, such as ping-pong balls.
2. possible breakdown of the boundaries of concurrent channels. Or price breaks strengthens the dominant trend, or punch him in the opposite direction to him, unfolding at the same time.
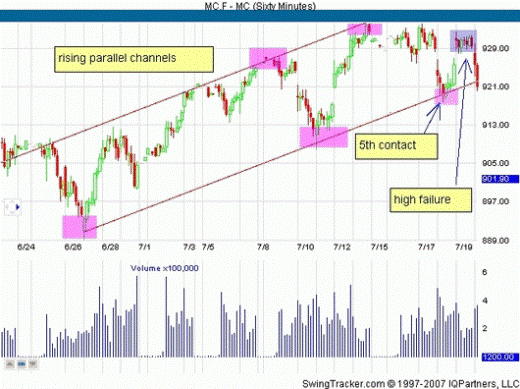
In this example, after a 5-second touch border concurrent channels (in this case lower) price bounced from the border and came up
Figure 2.
But the upward movement was not strong and did not last long. Price for this was less than fifty percent of the distance to the upper limit of concurrent channel, then turned again to the bottom line of this trend.
Once the price reached the bottom of the channel, we have received a confirmation signal that the chart pattern is likely to have finally emerged.The graph shows us the visual outlook of the market in the near future is preparing to consolidate, or to turn.
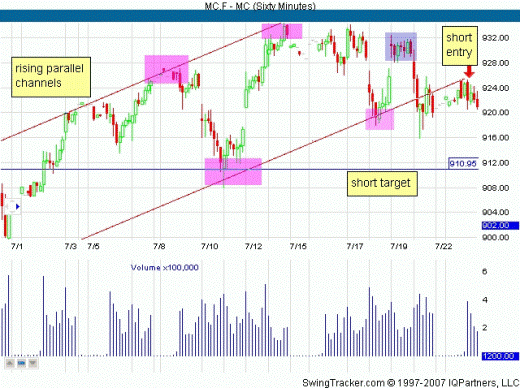
Although already at this stage, we may seem that the opening of short positions will help us to make, but in reality it remains too early to conclude the deal in the direction opposite the movement of a trend as long as we do not receive additional evidence — a lower maximum conversion or the lower trend line of support to the resistance.
Figure 3.
Deal to sell we discover at the time when the price on the chart returns to the former lower trend line, which turns into a resistance line on the chart. At that point, once the price touches the trend line, then turns down and eventually breaks through at least the preceding bar, so it gives us very good signal for the opening of trading positions.
Stop-loss orders can be placed slightly above the trend line, the highest peak of the bar, which was preceded by a breakdown of the line is considered a trend. Break up the trend line will say that the above calculation was erroneous, and the entrance to the market we hurried.
The first profit target wasdetermined at a specified level, since this is very clearly visible viewing level of support. The second profit target may seem even more perfect, as it is about round number — 900. In addition, this area is also visible support as before about this level, there was a reversal of the trend upward.
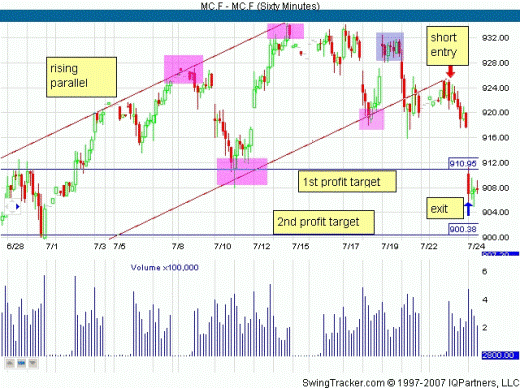
Figure 4.
First, a certain goal was reached very quickly, because on the charthas formed a gap down. Here you need to fix some profits and put in trade trailing stop for the remainder of the trade part of the open position. Stop-loss is move the gap to the bottom on 912. If price can break through this level up, it is better to liquidate the remainder of the trading position. But, as we see in our example — the price has not been able to break through this level.
Figure 5.
After a little consolidation of downtrend continued his motion and we reached the second, we have defined, profit target and successfully close a trading position at a profit.
Parallel channels are found at all time intervals, inputs and outputs in the market while working with them very well visible even the naked eye. Therefore, this pattern provides an excellent balance of risk to expected profits. Come and trade of these patterns is very simple.
All it takes is to identify this pattern on the chart, wait for it to develop in a low-risk setup and try to capitalize on its development.

![Trade Parallel Channels [Forex & Crypto Trading Strategy]](https://strategy4forex.com/wp-content/cache/thumb/42/164c24b14857d42_320x200.gif)