The 3 Indians / Three Movements [Harmonic Pattern] Forex & Crypto Trading Strategy – is a graphical pattern that periodically appears on the forex market and its correct identification will allow you, as a forex trader, to receive your stable profit, of course, while not forgetting about the risks when trading.
This graphical model is called by different traders in completely different ways, but its meaning is the same. So Linda Raschke (we have already considered her strategies on the website: 80-20 strategy, Turtle Soup Strategies, Turtle Soup plus One) called this model “3 Indians”, in wave analysis this model is called “diagonal triangle”, Larry Pisavento call this model “3-step pattern” (3-Drive pattern), Gartley – “Expanding 5-wave triangle.”
We will call it: the “Three movements” pattern.
But no matter how this pattern is called, its structure and meaning do not change at all. This forex pattern can be easily identified in any financial market (including the forex currency market), just as it works very well on any time intervals and on any currency pairs.
The Harmonious Three Moves Pattern often forms at the bottom or top of the market, before the trend reverses. But of course, it does not always give a signal about the main trend reversal. It can also signal the end of an oscillatory movement within the current trend and the beginning of a correction, rather than a complete trend reversal on higher timeframes.
Previously, we have already considered forex strategies in which the price, upon contact with the trend line: Forex Strategy on Trend Lines, Forex Strategy “Trend Lines”, Forex Strategy “3 touches” (usually after the 3rd contact) unfolded and this fact allowed us to earn, but in this forex strategy, or rather in the harmonious pattern “3 movements”, we will introduce an additional rule using Fibonacci levels and extensions (Fibonacci ratios).
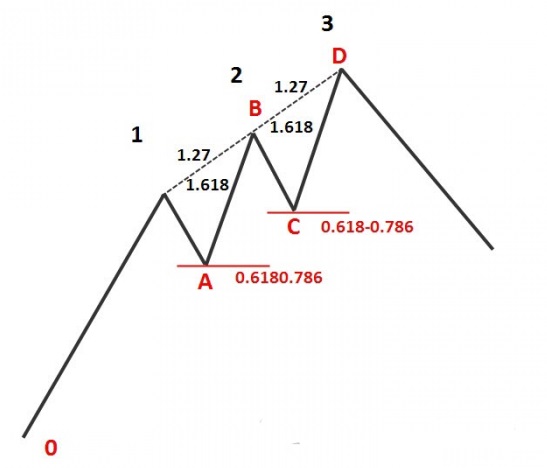
Let’s look at the Three Moves SELL pattern (Fibonacci ratios and trade conditions):
1) Point A should be at a distance – 0.618-0.786 Fibonacci from the segment “0-1” – but this is not a mandatory condition, but if it is met, then it is very good! This fact will indicate that the price is correcting and the movement will not be too sharp (impulsive), as, for example, with a correction of 23.6% or 38.2% Fibonacci.
2) When stretching the Fibonacci Extensions from point 1 to point A, we get point 2 at a distance of 1.27 or 1.618 Fibonacci.
3) Point C is also at a distance of 0.618-0.786 Fibonacci from the segment “A-B” or “A-2” – this is a prerequisite!
4) If these conditions are met, then at a distance of 1.27 or 1.618 (if point B is at a distance of 1.27 x 1A – then the distance = 1.27, if B is at a distance of 1.68 x 1A – then the distance = 1.68) from the segment “B-C” or “2-C” we place a pending Sell Limit order, in the figure it is designated as point 3 or D !
5) Segment AB=CD – if possible, but of course, such a ratio is ideal not so often in the forex market …
6) Stop loss is placed a few pips above the 1.68 level if B is at a distance of 1.27 x 1A
and a few pips above 1.786 if B is 1.618 x 1A
7) Take Profit:
1st target – 61.8% Fibonacci from the segment “0-3” – at this level, you can close part of the profit, rearrange the position to breakeven – it’s up to you.
2nd Target – 1.27 Fibonacci Expansion
Target 3 – Fibo Extension 1.618
It is up to you to decide where to close the profit, you can rearrange the position to breakeven and put it on a trailing stop or close the position in parts at each important level.
8) And of course, you should not forget about the rules of Forex Money Management when trading!
Here is an example on the chart – an almost perfect Three Movements pattern, but the profit only reached the first target – the 61.8% Fibonacci level from the 0-3 segment and reversed:
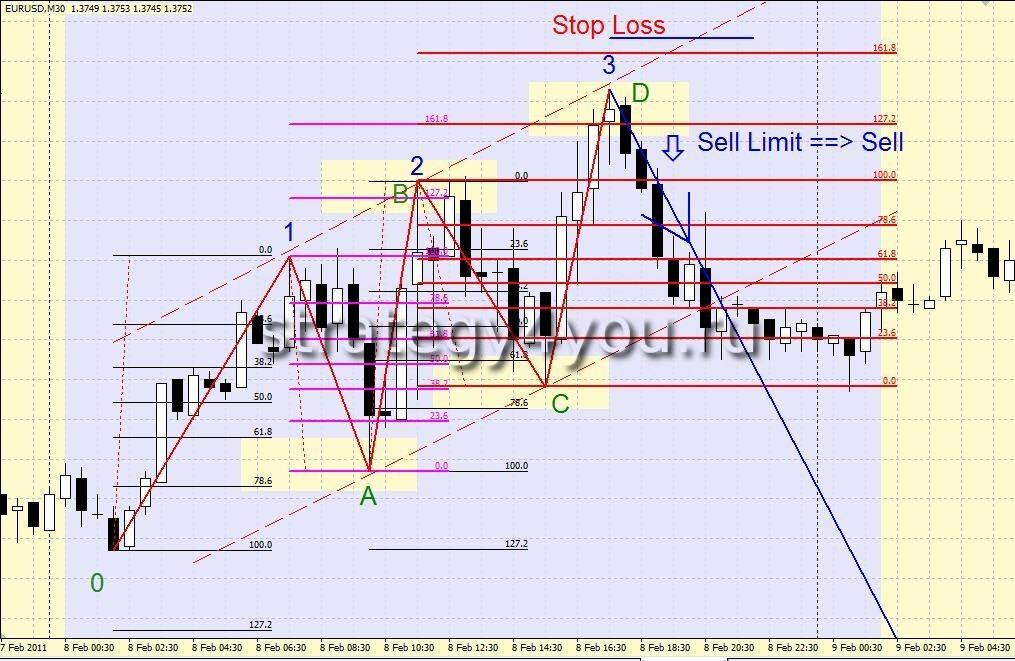
Just as you can see on the chart, the price is very well located in the parallel channel, which also gave an additional signal when it touches the trend line at point 3.
For BUY trades, the pattern looks like this:
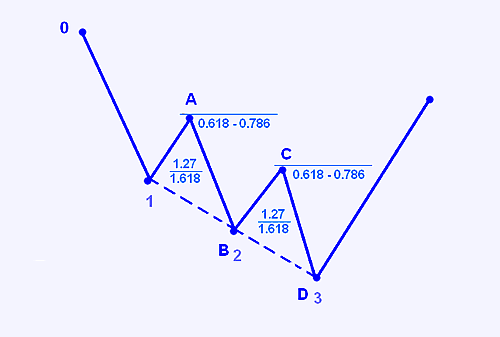
For BUY deals, the conditions are opposite to the “Three movements” pattern for sale!
Of course, we consider only ideal patterns of “Three movements”, there are also non-ideal ones in which the Fibonacci ratios do not match. But it is better not to pay too much attention to such forex models, because. and the probability that the model will work perfectly and allow you to close your profit also decreases …
![3 Indians / Three Movements [Harmonic Pattern] Forex & Crypto Trading Strategy](https://strategy4forex.com/wp-content/cache/thumb/7a/f007a64421b5f7a_320x200.jpg)