The “Three Falling Peaks” pattern [Forex & Crypto Trading Strategy] is a rather interesting and undeservedly neglected graphic model by a wide trading audience, which, like many other patterns, was originally used in the securities market and, therefore, the model is considered only in the direction of sales.
However, in the forex market, for well-known reasons, the direction of the trend is a very relative concept, and therefore it is possible to use the pattern in both directions (with an uptrend and a downtrend). In any case, we nevertheless considered in this article the classical (one-sided) option, that is, for sales.
- The time interval, as with other patterns, does not really matter, but it should be remembered that the older the TF, the more reliable this model is. The currency pair doesn’t matter either.
Description of the Three Falling Peaks pattern:
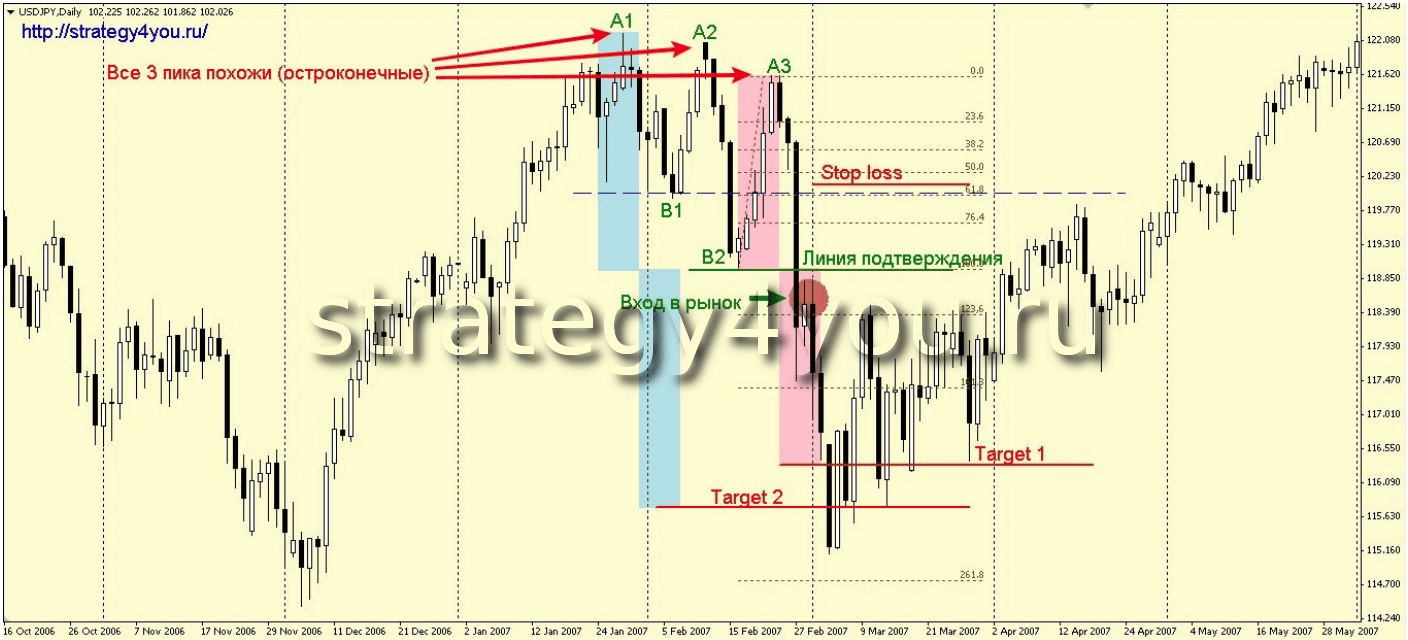
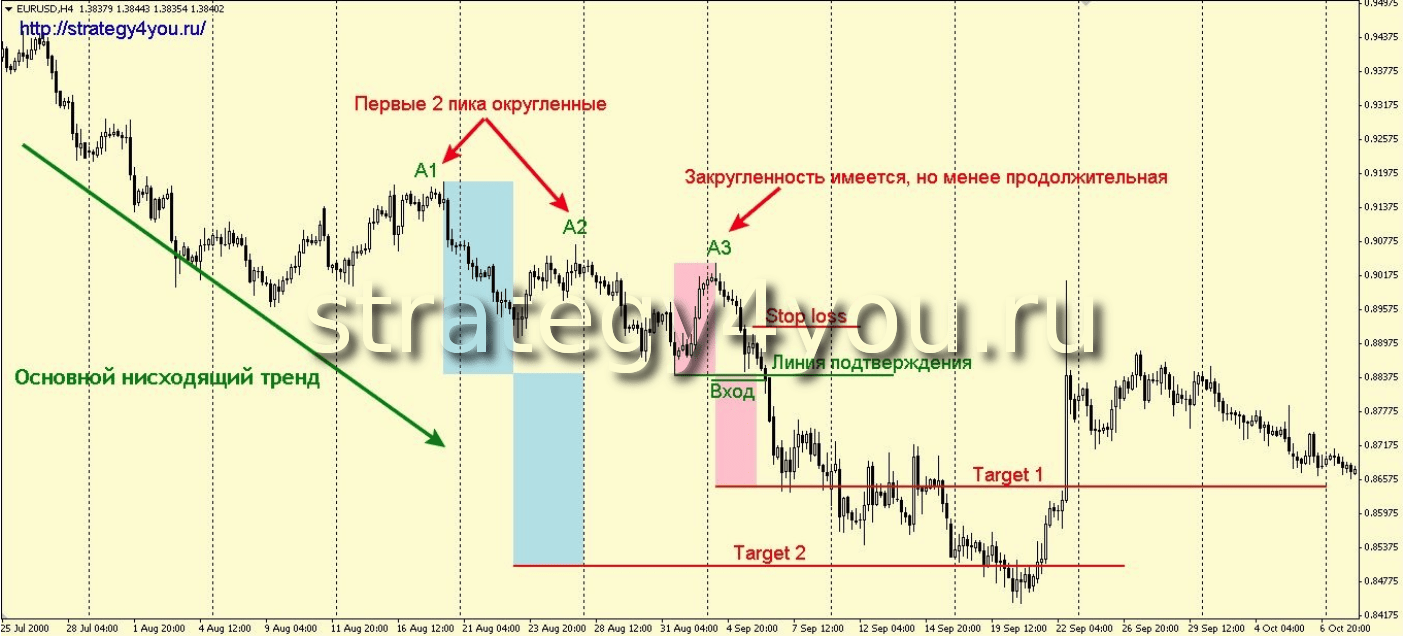
A rising market has 3 falling peaks. Moreover, the intermediate minimums do not have to go down, this moment does not play a special role. All these 3 peaks within one model should be as similar as possible in terms of the structure and nature of the formation. If the first peak has a pointed appearance, then the other two peaks should also have sharp ends (Fig. 1). The same goes for rounded, rectangular, forked views.
Trading the Three Falling Peaks Pattern:
On the last minimum (B2) you should draw a horizontal line – the confirmation line. After it breaks down and closes the candle of the TF in question, you should open a trading position for sale, subject to the following conditions:
A) If, after the breakdown, the price is within the fibonacci extension of 100 – 123.6 from wave B2-A3, we enter at the market price.
B) If the price turned out to be below 123.6 of the same extension, then you should wait for the price to return to the same zone (100-123.6) and only after that open a short position.
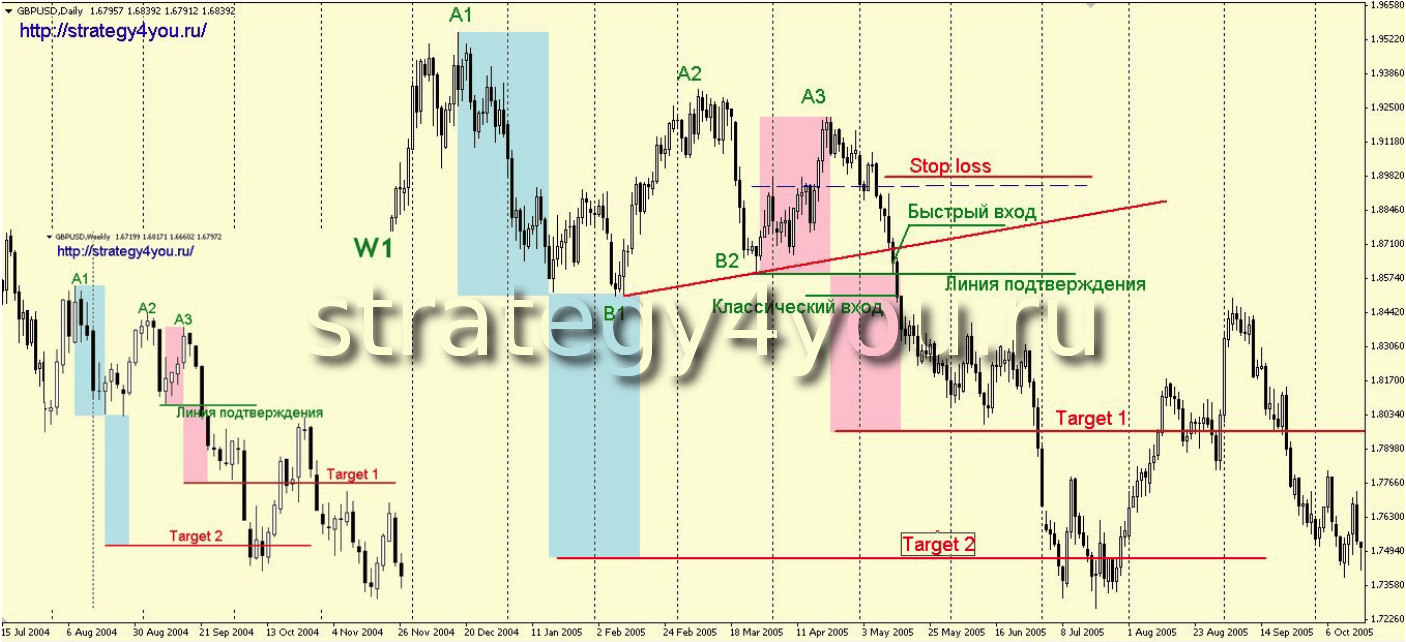
Stop loss can be set for the intermediate maximum formed inside the wave from point A3. If there is none, then you can place a stop order slightly above the B1 level, provided that B1 is higher than B2. In other cases, the stop loss is set at the nearest resistance level.
The 3 Peaks model has two target levels:
1) Distance B2-A3 delayed from the breakout point of the confirmation line (reached much more often than the second target).
2) The height of the whole pattern, i.e. the distance from the highest high to the lowest low within the pattern, measured from the breakout point of the confirmation line.
This pattern is applicable not only as a reversal pattern, but also as a continuation pattern. In this case, 3 clearly expressed similar in structure, falling peaks are formed on a downward movement. Such models work better, but in real time they are quite difficult to recognize in time (Fig. 3):
If B1 is below B2, you can also use an aggressive entry – a breakdown of the trend line at the lows of B1-B2 (Fig. 2)
You should also pay attention to the trend of the older time interval. Of course, the downtrend of the older time frame strengthens the signal.
If there is an important support level in the immediate vicinity of the entry point, then it is better to ignore such a signal.
![THREE FALLING PEAK Pattern [Forex & Crypto Trading Strategy]](https://strategy4forex.com/wp-content/cache/thumb/a7/a96e84e4cb246a7_320x200.png)