Subjective opinions, or «presenting the desired movement as real» — the main problem of many traders in the Forex market. The information presented in this paper trading strategy, «Sperandeo method» will allow more objective to build a trend line and use them to identify reversals in the forex market.
Forex traders are engaged in the construction of trend lines in order to celebrate the directed movement of prices and find the moment of changing the direction of the current trend.
In order to implement the construction of trend lines are much more objectively, I would suggest to use a step by step way that suggested by Victor Sperandeo (Victor Sperandeo). Very simple method trendline Sperandeo was named «Changing trends in the one-two-three» (1-2-3 change of trend).
The process of constructing a trend line by the method of «Change of trend in the one-two-three»:
A downward sloping trendline connects consistently lowers the resistance, or in other words — price highs. The rising trendline connects successively higher points of support or in other words — price lows. By basic definition, the trend line should be drawn through at least two maximum or minimum 2. But the difficulty in building begins as soon as the trader needs to determine through what highs or lows need to hold this trend line.
If you follow the method Sperandeo, descending trendline connects consistently lowering price peaks that precede the lowest minimum of the price movement. And on this basis, the rising trendline connects successively higher lows, which precede the highest high of the investigated price movements.
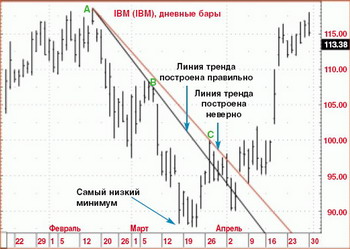
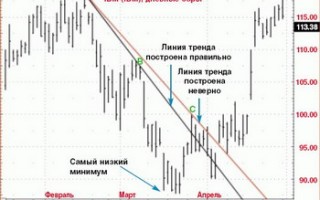
Fig. 1 shows examples of correct and incorrect construction of a downward trend line.
A trend line drawn from point A to B, was conducted properly, as point B corresponds to the maximum, the previous lowest minimum downward movement. Trend line, which is held from point A to C, was built wrong, because Point C was formed much later than the lowest low on the chart. Soon it will be clear why it is so important to the local maximum preceded the current minimum price movement.
Change of trend «in the one-two-three»
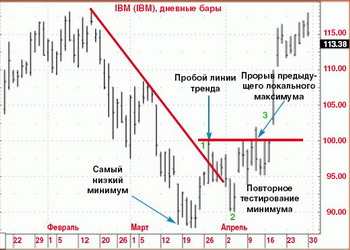
In this approach, we can speak about the change of the trend only if the three conditions (see Fig. 2):
1. Line of the current trend must be broken — point 1
2. The price on the chart, should again test the global minimum or maximum, as it happened at 2.
3. The price on the chart should pierce a level which corresponds to a local maximum or minimum, prior again formed (in the second test) the bottom or top of what we see in point 3.
Now it becomes clear why the trend line should be built exactly the way that it passes only through those local maxima, which previously preceded the minimum price movement on the chart. If we used a trend line, which was held from point A to C (see Fig. 1), then the time change of trend has already managed to finish half, and we only would get a warning.
But if the price would go lower and still made a lower low in the month of April, then in this case, we used to just line the AU, because now she would connect up that preceded the minimum price movement.
As we have said before — a trend line is carried through several successive increase or decrease the points of resistance or support. Then, after breaking through the consideration price trend line is re-tested minimum (or maximum) price movement on the chart. In other words, we are waiting for the completion of the formation of figures «double bottom» (or «double top»).
Using technology trendline on Sperandeo:
There are several variants of this approach. One of the strategies proposed by Victor Sperandeo, lies in the fact that buying an asset is carried out during re-testing the trendline (point 2 in Fig. 2)
2)stop-loss is considered a minimum price movement. Then, after the price has passed the point 3, the trailing stop-loss move just below the level that corresponds to the breakout point considered a local maximum.
Besides, this way of defining moment of change of the trend, you can also make decisions based on other techniques. For example, if you were registered breakout downtrend on the daily range, you can use it as a signal that you are using it to open a long trading position. Repeated testing (at point 2) — a critical moment, and even after the price of successful point 3, you can open an additional long trading position.
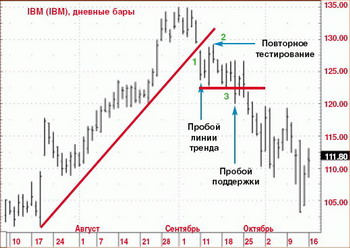
If the current trend reversal took place is always so beautiful, as was shown in Fig. 1, trading would be the easy thing. But often, a movement that corresponds retested price trend line tends to be very small, as you can see in Fig. 3. In this case, the price broke through a gap down trend line upward (point 1). Then the price in the market tried again to test the maximum, but could only partially fill the gap (see point 2) and again fell below the level of support (see point 3).
Fig. 3. Retest — shallow
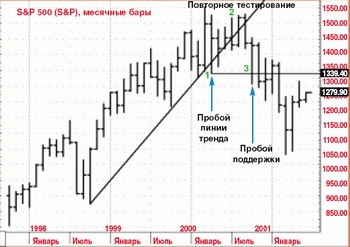
If you examine a large number of price charts, it becomes clear that the ideal price reversals in the market are very, very rare. Often the price on the chart or just change its direction of movement on her opposite, or outside the scope of consolidation. In this case, you need to go to the same analysis, but on a larger time interval. If the graphs on the interval D1 did not get an accurate idea of the direction of the current trend, you should use a weekly or monthly intervals. Fig. 4 reviewed by an example of a reversal of the upward trend in the monthly price chart.
Fig. 4. Reversal of the trend on the chart
A little more objectivity:
Trend represents nothing more than a collection of successively higher points of support or lowering the points of resistance. The construction of trend lines through them, according to the method Sperandeo eliminates the effect is not an objective opinion on the analysis. In addition, great importance has the final resistance (or support), which precedes the global maximum (or minimum). Break the trend line is an important event, and further price movement after breaking through these levels, which complies with these key points of support or resistance, is also an important confirmation of trend change in the market.
These movements on the chart, we can associate with the stairs. Until such time as the previous step is not completed, the market still can not determine the direction of his future movements, and often it is in the area between the global maximum (or minimum) and predschestvuyuschey point of support (or resistance).
Based on the technology Sperandeo, the local maximum, which lies between the global minimum and its re-testing — a potential point of breakthrough. Breakthrough at this level — indicates ascending direction of the market. And so, if there is breakdown of the level which corresponds to the point of resistance between the global maximum and a retest, the market price starts to fall. Well, if these critical levels are not pierced, then the market are most likely located in a trading range and the old trend is most quickly resumes.
Conclusions:
V. Sperandeo has developed very important rules for the construction of trend lines and determine when it shifts. He proposed a way to make this element of the analysis of price charts more objective. Of course, there may be minor traffic re-testing, and those who allow this to form a «double bottom» or «double top», and we can not predict the magnitude of pre-rollback when re-testing.

