Forex Strategy «Technique Chariot» — allows you to trade on the forex market occurs when one of the most difficult situations in trading — a condition where the price is gradually rising (uptrend should), but performs with the big kick-backs in the opposite direction.
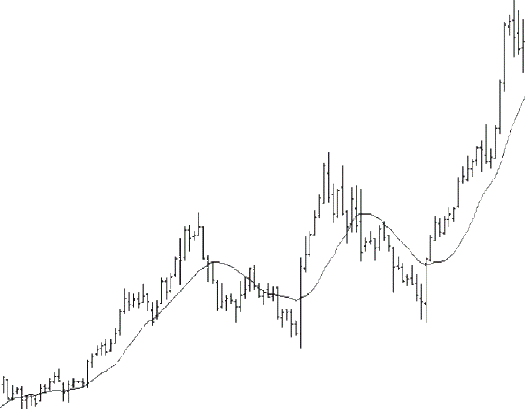
Simple forex strategy «Technology Chariot» (Sweet Chariot) was developed in order to use this kind of swings in the currency market is gradually growing. This forex trading strategy is quite simple, but effective in situations where the market price moving sideways (consolidated) for the general uptrend in the market. Trading System Engineering Chariot «uses in its algorithm for 40-day moving average to close (close) — SMA (40) — is present in a standard set of indicators for Metatrader 4. Example see in the picture:
Figure 1
Basically it is good to use on the weekly chart (W1), but it also applies to daily (D1) and intraday charts (H1 and H4).
Basic rules of trade on forex strategy «Chariots of Technology:
1. Once the price is above the moving average (SMA 40), open the long trading positions — buy.
2. And here is a short trading positions (ie sales) in this strategy does not open (so says the author of this forex strategy, although I personally think that you can use these same rules, only with «mirroring» — exactly the opposite. )
3. Once the price is in the flat (no sharp turns) and oscillates around a moving average — the new trading position can not be opened.
4. On the first plug, which is completely out of the moving average and closed at the top of the price range:
- Opens a long trading position (buy) at the first candle, at least 80% of the length of which is above the moving average, in the event that the closure of the spark happens in the upper third of the price range.
- Opens a long trading position (buy) the breakdown of the top of a candle that meets these conditions. This candle is called «candle entrance.
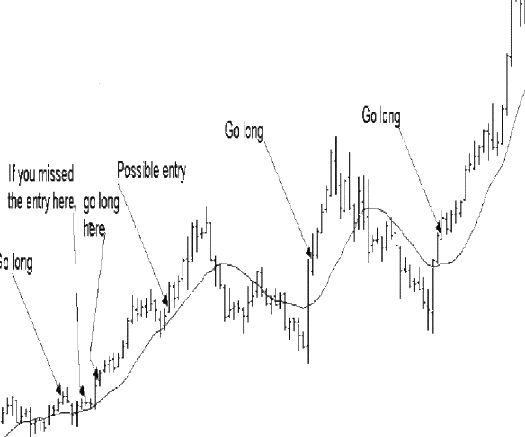
On the following price chart clearly visible places where you can open a trading position to buy:
Figure 2
Comments to Figure 2 (see left):
— Up to 1 st candles entry price fluctuated above and below the moving average. The first opportunity to enter the market at the price chart is available when the price emerged from under the moving average.
— Candle, which preceded the entry of the first candle, placed over the considered moving average. It closed in the upper half of the price range we are considering. It signals the possibility of opening a trade position to buy, but you need to enter the market during the breakdown of the top level of the candle. The same situation with the following combination of candles.
— The lower part of the next bar, which was preceded by a candle entrance, located under the moving average, but 80% of its price range are above this average, and it is already locked in the upper third of its price range.
— Candle, which preceded the penultimate candle entrance, divided moving average by about 1 / 2 and closed in the upper 1 / 3 of its price range.
— Candle, which preceded the last candle entrance is located above the moving average and closed the upper half of its price range. It is 100% corresponds to all parameters «candle entrance.
As for Stop-loss — it is better to put a Low candles, candle preceding entry.
Take-profit — at the request or trailing (step trailing choose to depending the selected time scale on the chart and the currency pair) or rearrange to zero and close frequently, as the price movement — a goal or a Fibonacci extension, or the nearest local maxima, from which jumping away price history.
Key observations to forex strategy «Chariots of Technology:
— Make sure that the price does turns over and sometimes under the moving average — the more turns, the better — this is sign that began to consolidate.
Make sure also that the market there is a trend, but not too steep (less than 45 degrees), because with a very strong uptrend price will almost always moving average.
— Do not forget to pay attention to the fact that the price should always be about moving average. If this condition is not satisfied, then trade for «Chariots of the technique is not necessary»!
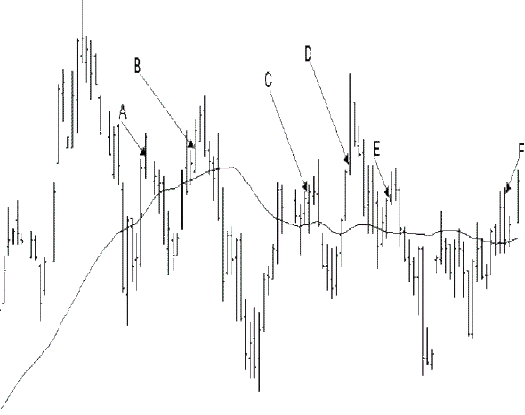
Not a very pleasant situation — when the price on the market moving sideways and moving average is also moving in this flat, while sometimes you may encounter the following difficulties, which you can see at the lower price chart:
Figure 3
To avoid these situations — I recommend using an indicator ADX, which is also present in the standard set of indicators for MT4 and it’s called — Average Directional Movement Index, how to use it — is described in detail in the Strategy on a combination of indicators ADX and PSAR


