FOREX trading strategy is a combination of indicators PSAR and ADX.
It’s no secret that absolutely any forex trader would like to know where is the bottom or top of the trend on a chart … and although sometimes it seems a solution to this problem seems simple, in fact, this is not so simply.
Predict whether a sequence was completed wave pattern, or we are witnessing at the moment just roll the larger trend — it’s really nothing like an art, not science.
In these situations we have to use multiple sources of information presentation, and it usually helps to avoid some false trading signals and ultimately save our funds on deposit in precisely those cases that predict us as traders good ratio of risk to profit. Always remember this, I’ll tell you in this forex strategy of using 2 completely different indicators, which we shared — is Average Directional Movement Index (ADX) and the index of Parabolic Stop and Reverse (PSAR). The combination of these two indicators allowed a forex strategy that allows to open trade transactions as close as possible to the top or bottom of a trend.
These indicators ADX (Average Directional Movement Index) and the PSAR (Parabolic SAR) is already registered in the trading terminal DC, working on the best platform for trading Metatrader 4. To activate them, go to the menu item Insert / Indicators / Trends and activate them one by one ).
To begin, we consider both these indicators one by one and analyze their characteristics.
Indicator ADX, or otherwise — Average Directional Movement Index:
The ADX is nothing like trading a trend following system, which was developed by Welles Wilder. This index can be used to trade on its own, but usually it is applied to the price chart along with an indicator of DMI. Which in turn is used to measure market trend.
Let us consider the mechanism of functioning of the digital indicator DMI:
1) It consists of 2 lines DI and DI —
2) to apply it in the following way: we open the position to buy as soon as the DI line crosses up DI-. And we’ll open the position up for sale as soon as DI — crosses above DI.
3) The intersection of lines DI / DI — gives trading signals on the input or output. But if these trading signals are used separately, they are quite often wrong, which often leads to a double loss. So, to filter these trading signals and is used indicator ADX.
The ADX is part of the trading system, which was devepoled Wilder. It signals to us that the price in the market is ready to change their direction of motion. As a result, combining ADX with DI, we eliminate unnecessary losing trades. The ADX helps the trader to determine whether there was a moment in the forex market trend or not, and gives us information about what stage we are the trend — the trend has just started or is already in its final stage. He also gives us information about the states of prices in the market as soon as there is no trend, as well as signals of turns and the resumption of traffic on the current trend.
But, remember that ADX can not determine the strength of the current trend and the more his line.
In Figure 1, red line represents the DI -, Blue Line — DI, and the green line is the ADX. At 20 held a line horizontally to the indicator ADX, how do some of the rules of the growth indicator ADX — values higher than 20 means nothing, as the formation of a trend.
Figure 1
Hence from the above, if trading, we will follow closely the lines of the indicator — DMI, it will allow us to see the correct display of the trend, as well as allow you to open trading positions in the right direction. Red line, we have already identified on the chart a situation where-DMI is above the DMI, indicating that the downtrend. Blue line, we have already identified the situation in the chart, when DMI is above the-DMI, indicating that the upward price trend.
It is also noticeable that on the chart are periods when the lines DMI very often overlap with each other. This is precisely the situation that can easily lead our commercial position to double damages, and when indicator ADX gives us a good filter. This indicator indicates the beginning of a trend, as soon as his line begins to move from their lows up. Ideally, the analysis of possible entry into the market, ADX must always be directed only upward.
Also, it will surely help us to determine the time, which indicates the end of the trend.
Reversal point of the market prices can be found as soon as DI / DI flipped on the upper or lower extreme values, followed by a down turn indicator ADX. These settings are often coincide with a reversal in price in the market.
Based on the foregoing, to exit the market, have formed the following trading terms:
1) line of DI / DI-should tell us about the decay momentum in the extreme values of the level, turning down at the same time.
2) they just have to cross the indicator ADX, which is directed upwards, downwards.
3) trade deal closes as soon as the ADX then begins to turn down.
All intersections in the future, DI / DI-may make us even further trading signal a change of trend.
If the trend still exists, then the line DI indicates his transition into the lateral movement (flat), and then crosses the bottom line indicator ADX (which can still be pointing upwards). Final confirmation of trend change down to just turn down the line indicator ADX. And after that additional evidence may be crossing the line down the line DI DI-.
Exactly the same in the case of an existing downtrend DI-will signal a passing trend in the lateral movement — flat, after which the crossing of the line ADX (which can still be pointing upwards). In confirmation of changes to the existing trend is up, will turn down the line indicator ADX. And for this may be followed by crossing the line DI-DI lines down.
Using indicator ADX to return to the trading position in the market, called the concept of «pivot point».
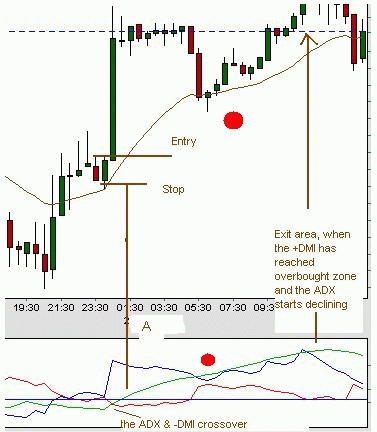
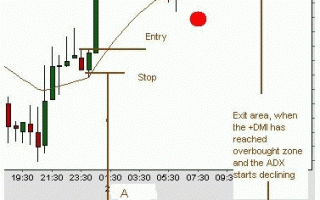
If we apply these rules to the above example in Figure 2, you will get this.
Opportunity to enter the market can be considered only at the point which is marked by the letter «A» as soon as the ADX begins to grow underneath. The chance of a trade position considered as soon as DMI reaches its extreme level, after which the ADX turns down.
Although these units are quite reliable, we can use for yourself yet another signal to confirm that, because usually turn down the ADX indicator is earlier than the later of them crossing DI / DI-.
Figure 2
However, very often crossing followed by a U-turn indicator ADX down occurs much later that the price on the chart has already passed is not a small distance from the moment of change in trend. That is, we will lose part of their profits.
It is with this aim — the aim here is to reduce this lag, it was decided to slightly improve this trading strategy, while introducing into it an indicator PSAR. It will provide much more timely signals to enter the market.
Indicator PSAR.
Digital Indicator — Parabolic SAR was developed as Welles Wilder and was proposed for use in trending markets. The author recommended to first determine the trend, and only then start to use the PSAR indicator for trade in the direction of the ongoing trend.
Indicator, in use, draws on the chart points that are collinear with the trend. This trading system is still often called the pivot and use it to set the trade order — a stop-loss, and not to trade with the trend.
Interpretation of indicator PSAR.
And so, if the trend at the moment is rising, we conclude a deal to buy as soon as the SAR begins to move under the price. These points will be our stop-loss order below the current price on the chart, and it will move upward until the stop-loss will not work (ie, the price does not fall below the level of stop-loss).
If the same trend — downward, begin to sell as soon as the SAR draws a point over the price. And it will be the level of stop-loss above the current price, he will also move down each time until it is activated (as soon as the price is above the level of stop-loss).
This concept implies that if the price will rise, then the point will also be moving up, perhaps slowly at first, and then will pick up speed along with the moving trend. And gradually, with the development trend, SAR begins to draw a little faster as a result of traced points coincide with the price levels. This phenomenon is called activation of the stop level and the implied trading signal for closing a position to buy.
Disadvantages indicator PSAR.
Although the SAR indicator very works well in the financial markets with the prevailing trend, its application is quite inefficient at fletovyh and pulse on small intervals markets. Once in the currency market is not addressed, sustainable trend indicator point jumping up and down, and thus determine the levels of entry and exit into the market is quite difficult.
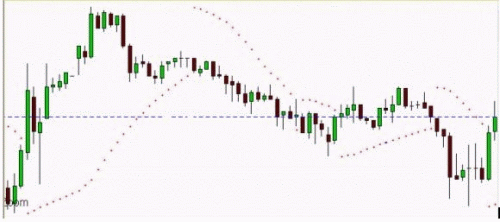
Figure 3 shows an example of the use of this indicator.
Figure 3
Suggest, for example, more closely follow the behavior of the indicator SAR.
Figure 4
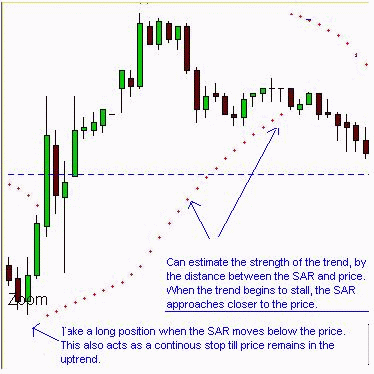
Let’s open a buy position at the point marked on the chart. This point was under the price, at a time when it started an uptrend. Moving and drawn together with the movement of the price point we will use as a stop level. Looking at the schedule, we can estimate the effect of the upward trend by analyzing the distance between the points and costs. The greater the distance — the stronger the trend, the less the point closest to the price chart.
Figure 5
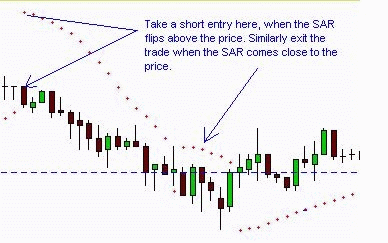
The same will be As concerns and the downward trend. The position on the sale will be open, after a point is moved and is over priced. Data point is used as a stop-loss. And as in previous example, just under withering trend closer to the price.
Now let’s combine the two trading techniques and combine them into one, improved.
So how do we see light PSAR works quite well in trending markets and gives the trader an excellent trading signals, but only when pronounced trends. And the closer the trend to wilt, so close to him are points digital indicator. This is precisely what we really need for a profitable forex trading!
That is, as soon as the parabolic SAR indicator closer to the price and once formed install «pivot point» on indicator ADX, we have everything for making a profitable trade!
And even with a very small counter-trend movement in the price chart will display the intersection of Parabolic and we will be a signal to enter the market.
These signals are usually generated before the moment when the ADX turns down.
In addition, we can also use the PSAR indicator for determining the output of a position. Open positions are closed as soon as the indicator PSAR dot appears on the other side of the price chart.
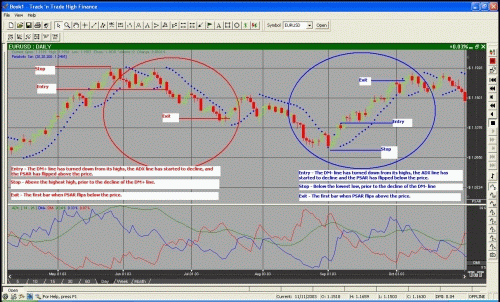
In Figure 6 you can see two examples of a change in trend: the sale and purchase.
Entries into the market, stop-losses and outs of trading positions are marked on the chart, in accordance with the above rules

