Dear traders, today we will consider Forex strategy for the RENKO chart “FXR-Modern”.
As you know, the standard set of charts of the MetaTrader 4 terminal includes: a line chart, a candlestick chart and a bar chart, it does not include a RENKO chart, so to get this type of price chart, you should perform the following actions:
– download the auxiliary expert RenkoExpertAdvisor and install it in the folder of your trading terminal in the section > MQL4> Experts
– open a minute chart (M1) of your chosen currency pair.
– download quotes for М1 of the same currency pair (MANDATORY).
– install the Expert Advisor on the chart, having previously marked the birds as shown in the following figure:
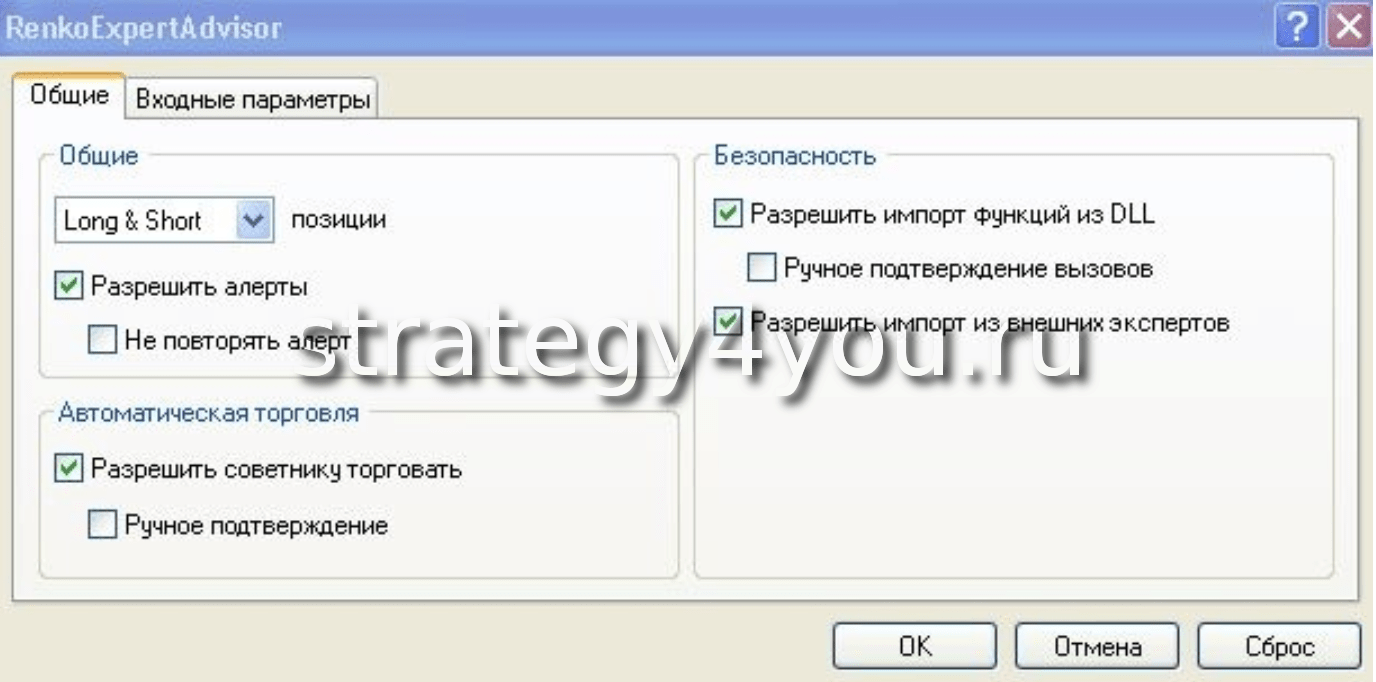
– click on the button to activate advisors (Auto-trading)
– through the file tab > open offline > your currency pair, TF M2.
– in the resulting window, select the candlestick chart.
If all the conditions are met correctly, you will get the following chart view of the selected currency pair:
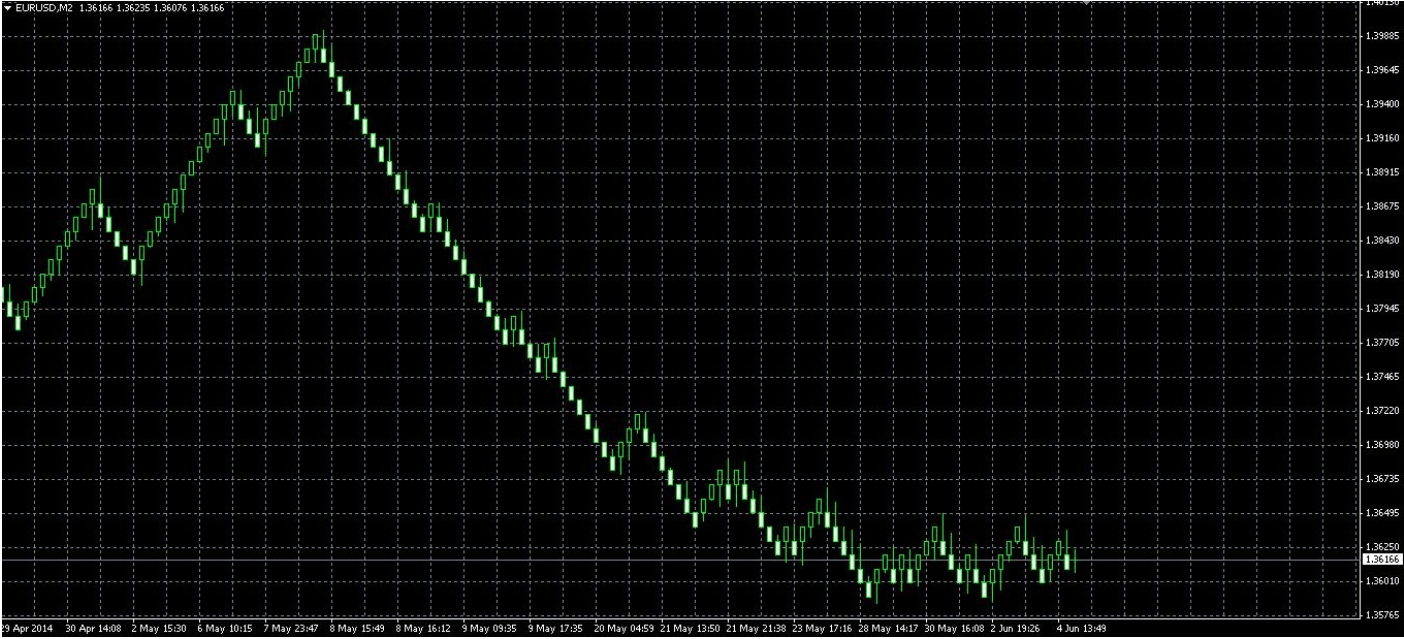
By default, the EA specifies a brick size of 10 points (this is the size we need for this strategy). The M1 chart, on which we installed the Expert Advisor, should in no case be closed, since it is on its basis that our RENKO chart works. Also, you should not change the time interval on the M1 chart.
Since the RENKO chart does not take into account the time component, there is simply no time interval in this strategy.
The currency pair does not matter.
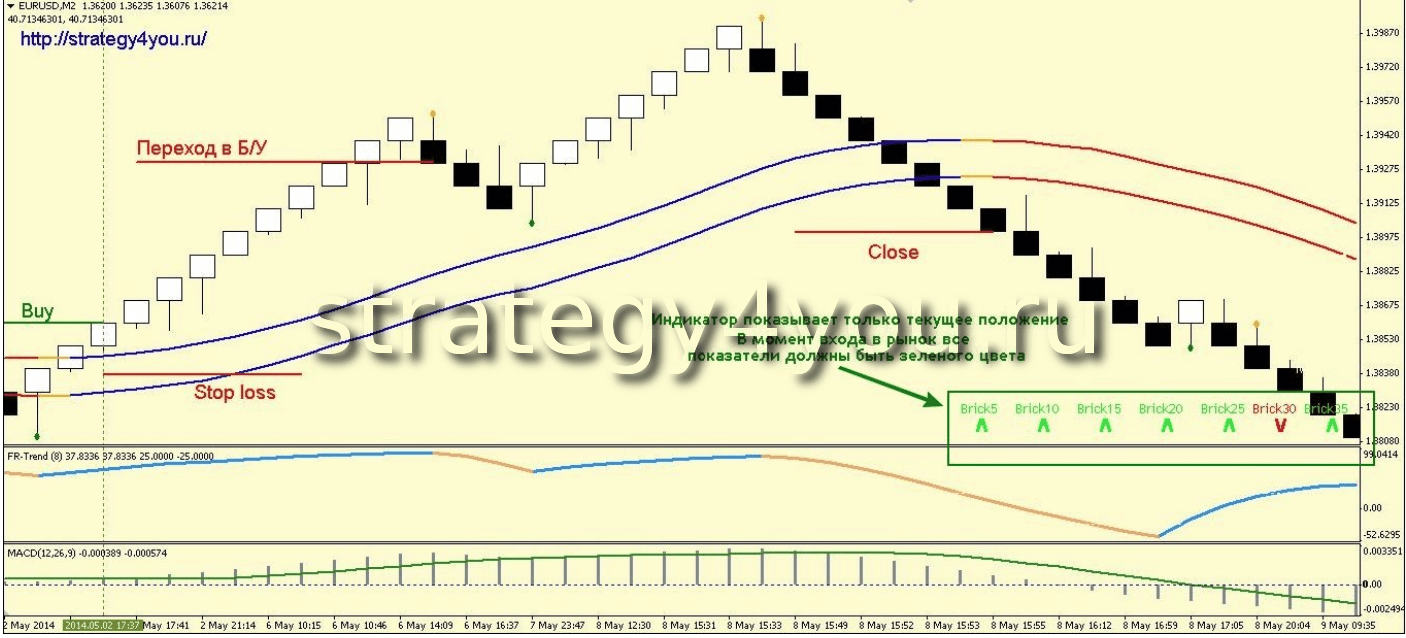
Indicators used in the Forex Strategy for the RENKO chart “FXR-Modern”:
1) Scanner – shows the direction on RENKO charts with different brick sizes (5; 10; 15; 20; 25; 30; 35). Located on the chart in the lower right corner. The red color of the corresponding size and the down arrow indicate the direction of the price down on the corresponding chart, the green color and the up arrow indicate an upward movement.
2) Trendlines – two parallel curves on the price chart.
3) Signals – draws orange and green diamonds above and below the price.
4) Trend – displayed in a separate window as a curved line, either blue or orange.
5) MACD with parameters 12; 26; 9.
It is recommended to trade during the European and American sessions.
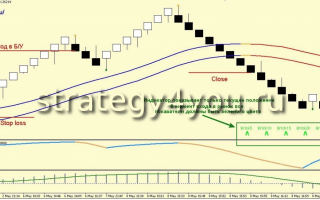
Conditions for buy trades using the FXR-Modern strategy:
1) Signals has drawn a green rhombus under the price.
2) Trend turned blue.
3) The price is above the Trendlines indicator, which in turn is colored blue.
4) The MACD indicator indicates an upward movement (the indicator scale is above its own moving average).
5) All indicators of the Scanner indicator should indicate an upward movement (all arrows are directed upwards and are colored green). With a more risky approach to trading, one of the extreme indicators (brick size 5 or 35) does not match.
If all conditions are met, at the final formation (closing) of the brick, you should open a buy deal.
6) Stop loss is set between two lines of the Trendlines indicator. In some cases, its size can be quite large, so we recommend weeding out high-risk trades (with large stops) in accordance with your money management rules
As soon as the indicator draws a rhombus above the orange price, we move the deal to breakeven.
7) We exit the trade if, after the appearance of an orange rhombus, the Trendlines indicator changes its color from blue to red.
Also in this strategy, you can apply a trailing stop, the size of which will depend on the currency pair you have chosen. For example, for EUR/USD, a trailing stop of 50 pips is a good fit.
Conditions for transactions for sale:
1) Signals has drawn an orange diamond above the price.
2) Trend turned orange.
3) The price is below the Trendlines indicator, which in turn is colored red.
4) The MACD indicator indicates a downward movement (the indicator scale is below its moving average).
5) All indicators of the Scanner indicator should indicate a downward movement (all arrows are directed downwards and are colored red). With a more risky approach to trading, one of the extreme indicators (brick size 5 or 35) does not match.
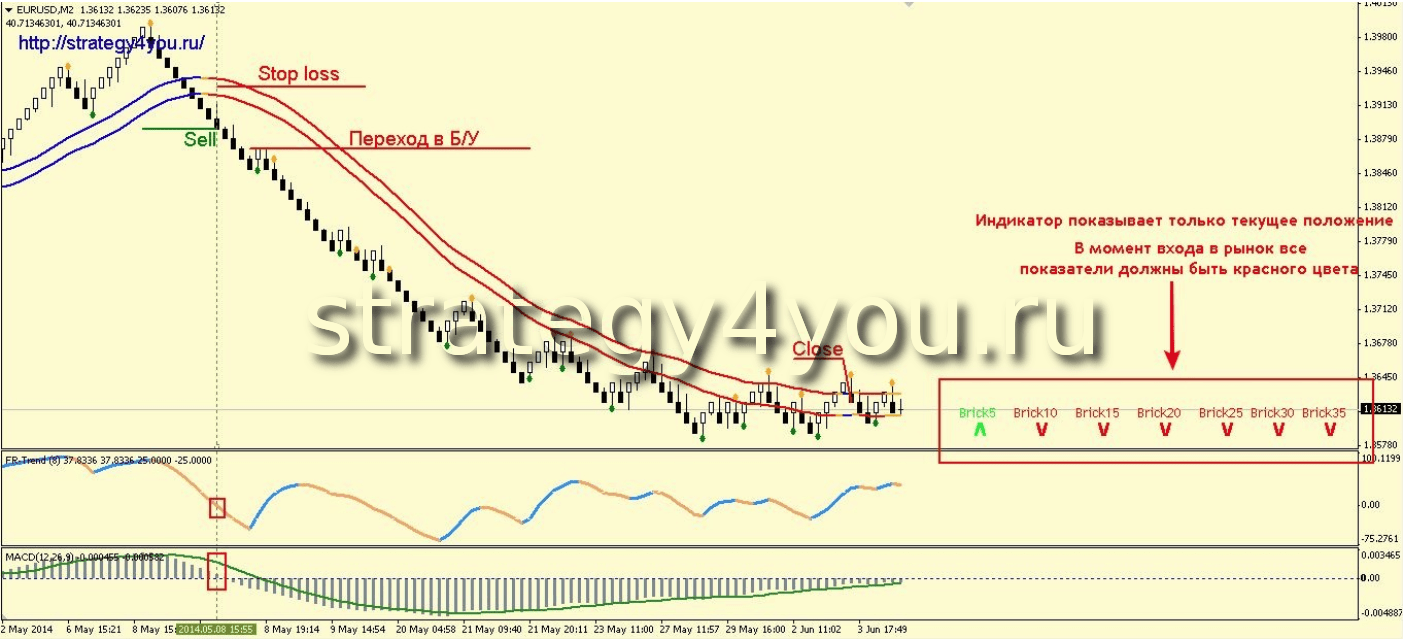
If all the conditions are met, at the final formation (closing) of the brick, a sell deal should be opened.
6) Stop loss is set between two lines of the Trendlines indicator. In some cases, its size can be quite large, so we recommend weeding out high-risk trades (with large stops) in accordance with your money management rules
As soon as the indicator draws a rhombus under the green price, we transfer the deal to breakeven.
7) Exit the trade if, after the appearance of a green rhombus, the Trendlines indicator changes its color from red to blue.
Also in this strategy, you can apply a trailing stop, the size of which will depend on the currency pair you have chosen. For example, for EUR/USD, a trailing stop of 50 pips is a good fit.
VIDEO to the Forex Strategy for the RENKO chart “FXR-Modern”:
- Recommended to watch with English subtitles!
Download MT4 template for this forex strategy – fxr_modern (archived)
Download RenkoExpertAdvisor
Download indicators: Scanner.ex4, Trendlines.ex4, Signals.ex4, Trend.ex4 (archived indicators_fxr_modern)
Install the indicators beforehand in: MT4 menu “File” > Data directory > MQL4> Indicators.