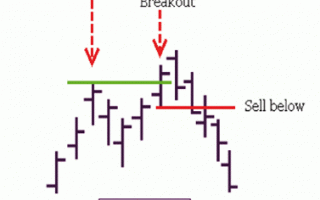
The 2B pattern is also called a “spring”, it looks like a small letter M or W on the chart and gives a signal about a possible reversal of an uptrend or downtrend as soon as the price in the market stops forming new, much higher highs or lows.
For the first time, the 2B pattern (an excellent and very strong reversal trading technique) was described in the book by Victor Sperandeo (in the circle of traders he was then known as Trader Vic) “Speculating professionally”.
Trader Vic described this excellent technique as follows: “In an uptrend, if the price in the market touched the previous price high, but failed to cross it the first time, and immediately fell below the previous price high, this indicates that the trend in the market is now — that will make a U-turn. The opposite rule is also true for a downtrend.
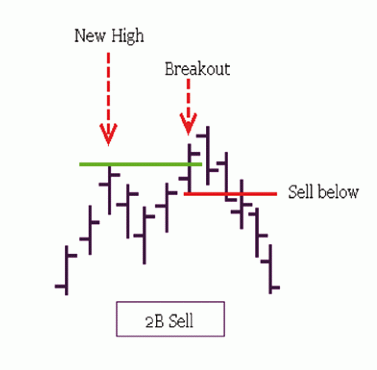
The rules of the 2B pattern are applied as soon as the price in the market forms a new high or low, and after that a tangible pullback. After the rollback, the price again tries to test the formed price maximum or minimum. Once this test of a «new» high or low fails, it is a signal of a potential reversal of the previous price trend. This setup is quite powerful and signals the trader about the beginning of a correction in the market.
2B patterns can be found on intraday setups and for making intraday trades by finding trend tops and bottoms is quite useful. Forex traders can also use in the analysis of 2 peaks and 2 bottoms The volume of transactions. If this volume on the second peak or day is less than on the first peak or day, then this tells him about the divergence and the formation of a possible 2B formation.
Rules for Forming Vertices 2B
The market is currently in an uptrend in price and is making a new high (20 bar high), after which there is a pullback in the market (visible on the price chart), which consists of 5-8 bars. After a pullback in the market, the price tries to break through this new high and closes above it. It is this bar that is called the “breakout bar”. But there is no close above the top of the breakout bar because the price closes below the low of the breakout bar. In this way, the formation of the 2B pattern at the top is completed.
The stop loss is above the recent swing high.
The profit target is at the swing low that preceded the New High.
Rules for Forming Bottoms 2B
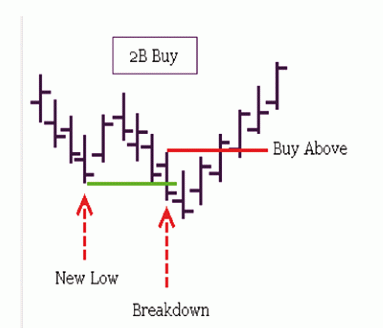
The price on the market forms a New Price Low (20 bar low). After a new price low is formed, the market pulls back, consisting of 5-8 bars. After that, the price attempts to return to the previous trend, as a result of which the bar closes below the New Low. This bar is called the “breakout bar”. But the subsequent continuation of the price trend in the market is not observed. Very soon, the price closes above the price high of the “breakout bar”. As a result, the 2B pattern is considered formed.
A buy trade position is opened above the high of the price bar that closed above the high of the “breakout bar”.
A stop loss should be placed below the previous swing low.
The desired profit target is at the swing price high that preceded the New price low.
Conditions for concluding a deal to buy 2B
1. Formation of a new low.
2. There is a price rollback.
3. A Bar is forming that closes below the low of price bar 1.
4. We mark the high of bar 3. We are waiting for the bar to close above 4.
5. Open a trade to buy at the maximum of 4.
6. Profit target (take profit) — the old swing price high.
2B — conditions for concluding a deal to sell
1. Formation of a new high.
2. There is a price rollback.
3. A Bar is forming that closes above the high of price bar 1.
4. We mark the minimum of bar 3. We are waiting for the bar to close below 4.
5. Open a trade to sell under the low of 4.
6. Target for profit (take profit) — the old oscillatory price low.
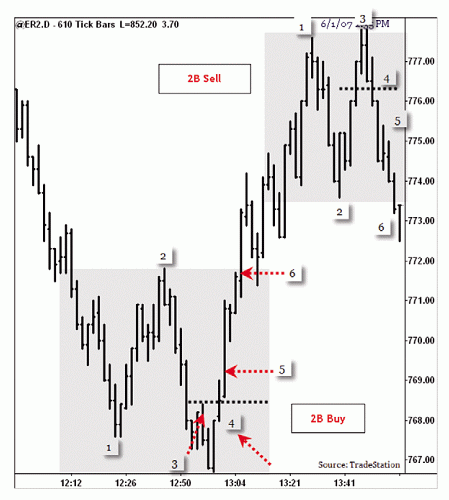
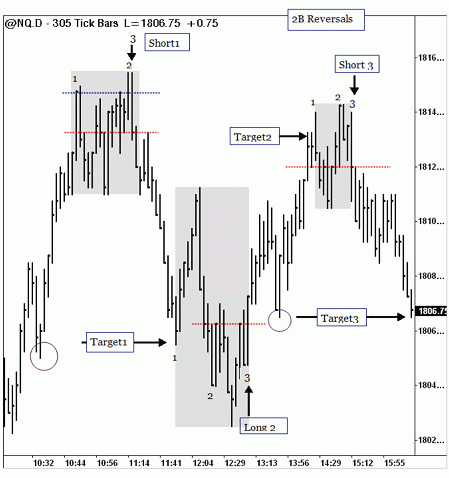
A series of 2B patterns on the intraday price chart:
The first example is a 2B price pattern for a sell trade. A short trading position is opened below the close of the bar (3). The profit target is the swing low that preceded bar 1. The stop loss is above the high of bar 2.
The second example is a 2B price pattern for a buy deal. A long trade is entered above the high of bar 2. The profit target is placed above the swing high formed prior to bar 1. The safety stop loss is placed below the «swing low» that preceded bar 3.

