Algorithm 4-x hourly MACD Forex Strategy:
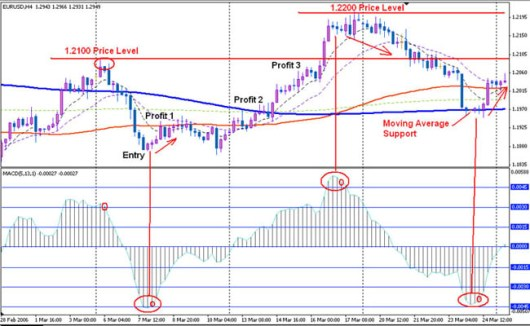
As the author of this forex strategy, its yield is an average of 300 pips in a month — a signal for entry into the market are the patterns of indicator forex MACD on the 4-x hourly price schedule for any selected currency pair trade. Target levels of income and levels of safety stop-loss, are determined by trade support and resistance levels, as well as moving averages or trading Fibonacci levels.
The indicators used in Forex 4-x hourly MACD Forex Strategy (all of them are present in the trading terminal MetaTrader 4):
Moving Averages:
- 365 Exponential Moving Average (365EMA) — exponential moving average with a period of 365
- 200 Simple Moving Average (200SMA) — simple moving average with a period of 200
- 89 Simple Moving Average (89SMA) — simple moving average with a period of 89
- 21 Exponential Moving Average (21EMA) — exponential moving average with period 21
- 8 Exponential Moving Average (8EMA) — exponential moving average with period 8
Forex Indicator MACD:
- Fast EMA 5
- Slow EMA 13
- MACD EMA 1
Horizontal Lines:
On the chart of the MACD indicator is installed 3 sets of horizontal lines above and below the zero line.
Above zero:
- Level 0.0015
- Level 0.0030
- Level 0.0045
Below zero:
- Level -0.0015
- Level -0.0030
- Level -0.0045
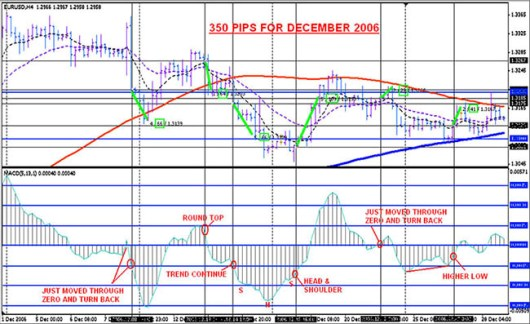
That’s about how your chart should look like, after opening all the indicators and settings.
Patterns that create an indicator MACD, are usually very profitable. But the need to use only those trading signals that have a greater likelihood of making a profit.
In the example below, are more profitable patterns.
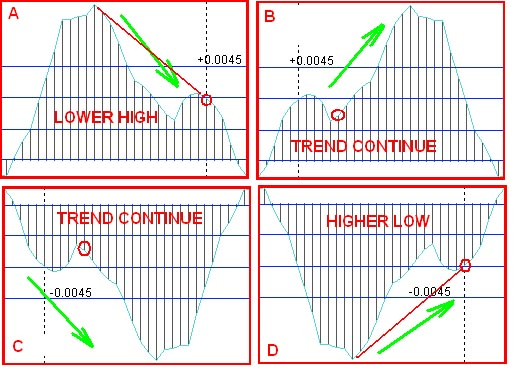
On the patterns A and D, the MACD indicator has moved beyond the level of 0.0045, normally, it says forex traders about a possible corrective movement or change of trend. This counter trend patterns.
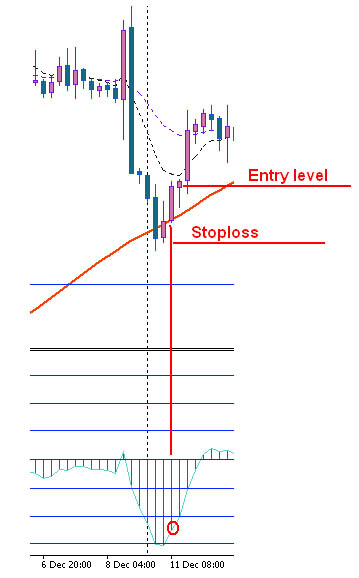
Patterns B and C — are trendy, they allow traders to enter in the direction of the main trend. Red circles indicate the signal for the transaction, to enter the market to the opening of the next bar.
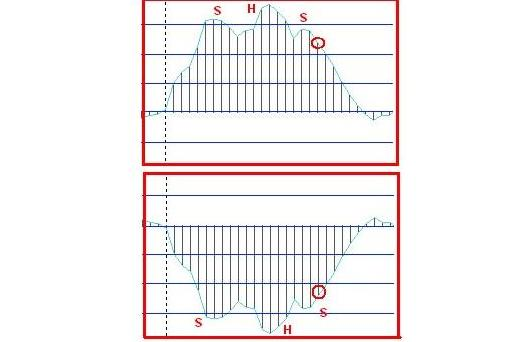
Pattern Head and Shoulders:
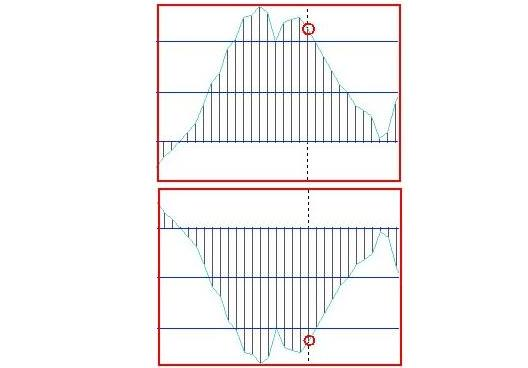
Pattern of «double top and bottom»
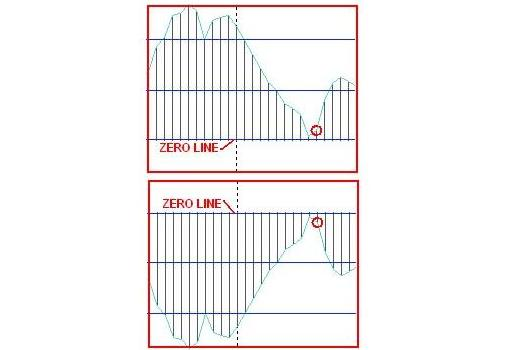
As soon as the MACD indicator is reduced to the zero line and turns back toward the main trend, holding just above its zero line — it is a signal to continue the trend. For such price movement just need to sell because it is very often quite strong.
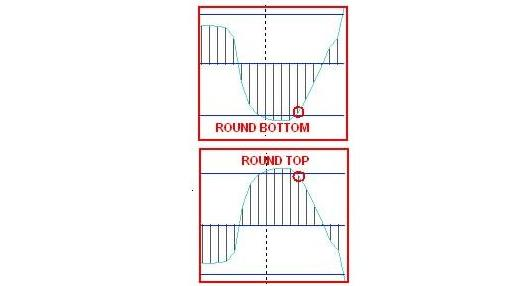
Pattern Round tops and bottoms:
Is also a call to action. Just be careful when the MACD indicator is located within the first zone of 0.0000 and 0.0015 above or below zero. Good signal to a deal will be considered a pattern, if rounding is formed at least 5 bars.
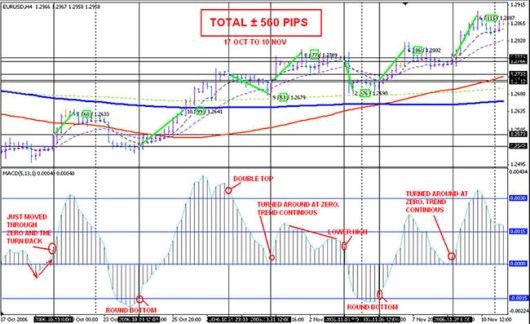
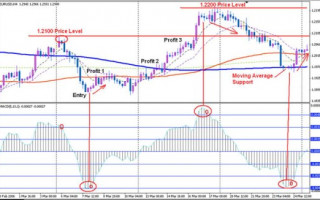
Examples of patterns of the MACD indicator on real graphs:
