ROOKS Pattern [Forex & Crypto Trading Strategy] – The basis of the Forex Strategy “Rooks” are graphical constructions on the price chart, and to build “Rooks” the usual MT4 indicator – ZigZag is used.
As well as standard tools:
- Andrews Pitchfork
- Fibonacci Levels
- This FOREX strategy is multi-currency
- And works on any timeframes!
Pattern “Blue Rook”:
You can see an example of construction in Figure 1.
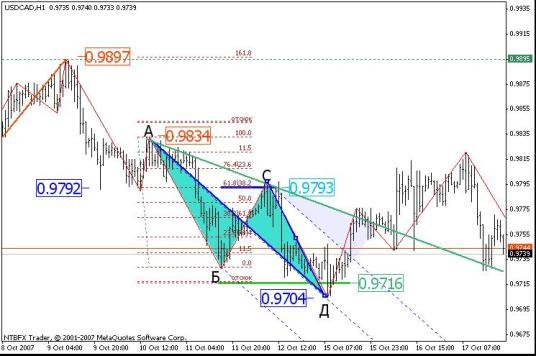
We find the downward movement and designate it as AB – we build Fibonacci levels along the segment AB. At the Fibonacci level of 61.8% – the price level of 0.9793, the price rebounds – we get the BS segment and after that the price falls to the “rebound” level – 0.9716 – we get the SD segment.
So this figure turned out, which can be called “a rook flying down.”
And so we define the points:
A – tail
B – rook paws
C – rook ears or top of the head, as you like
D – rook beak.
After the formation of the “rook”, we build the Andrews pitchfork from the tail, paws and “crown”!
So we get the 1st signal to conclude a deal to buy – the intersection of the upper pitchfork of Andrews by the price.
If we draw a green straight line through the peaks of the AC, then together with the Andrews pitchfork, we will get the market entry sector. Moreover, it should be noted that this “rook” seems to be pecking at its feet – this is nothing more than a divergence – and this is another signal to conclude a deal to buy.
Stop-loss should be set at the lowest point of the “rook” – in this case – below point D.
Take profit is either not set, and the position is trailed. Or bet at least above point C or A. You can also partially close the trading position when these points are reached.
Pattern “Red Rook”:
The “Red Rook” is built similarly to the blue one, but in this case it “flies up”. And the most important – without the “blue rook” there will be no red and vice versa. This is very important, because if we draw all the rooks correctly, then we will have approximate return points (see examples in the figures at the end of the forex strategy).
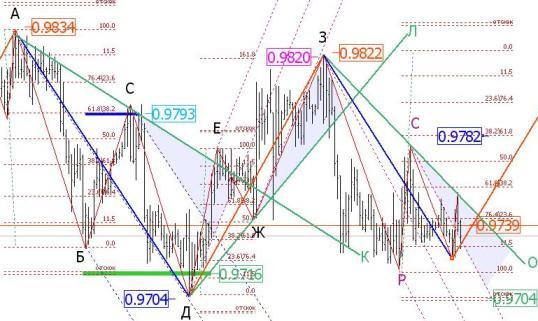
The segment DE appeared – we build Fibonacci – we get a rollback of the Hedgehog. It slightly did not reach the level of 61.8%, therefore (according to the theory of Elliot waves) there is a much higher probability of a more powerful upward movement. Minimum for a “rebound” to the level of 0.9784, maximum for the level of 1.618% (indicated as point Z on the chart). Then we build the Andrews pitchfork, draw the green Hedgehog line – as a result, we get the sector for entering the market for sale. And when the “red rook” fell to the level of 0.9784, it broke down.
In this case, the stop loss should be set beyond the highest point of the “rook” – in this case, below point Z.
Take profit is either not set, and the position is trailed. Or place at least below the W or D points. You can also partially close the trading position when these points are reached.
And so on – a blue rook begins to form …
Another important addition
I recommend using a system of three screens with three different t / f on which “rooks” also appear, and already analyzing the appearance of small and large “rooks” gives a more complete picture of what is happening on the market.
And just like in the theory of Elliott waves, “small rooks” gather in the so-called “flocks of rooks”, i.e. you can already choose 2 red and one blue to combine into a larger rook – try …
If it turns out, for example, that point C is higher than point A (see Figure 1), then you need to enter the deal at BuyStop, and for a sell deal – at SellStop, respectively.
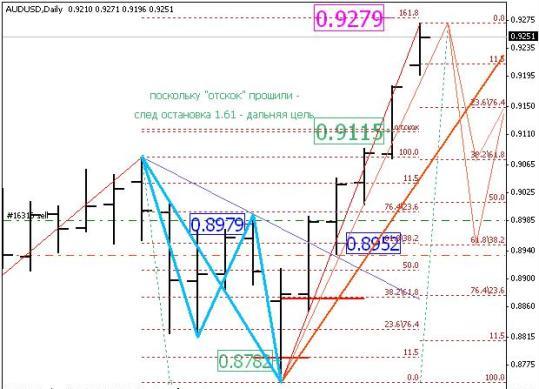
Examples of building Rooks:

And Video examples:
Video Forex Strategy “Rooks”:
- Recommended to watch with English subtitles!
![ROOKS Pattern [Forex & Crypto Trading Strategy]](https://strategy4forex.com/wp-content/cache/thumb/7f/9139742384c387f_320x200.jpg)