CRAB Pattern [Forex & Crypto Trading Strategy] – Harmonious models are on a par with classical graphical models in the financial markets.
They are one of the most accurate methods for predicting further price movement in the market, since Fibonacci numbers (levels and their extensions) play an important role in determining and building a pattern.
The Crab pattern is considered to be one of the most effective harmonic patterns. Earlier we considered patterns:
The harmonious Crab model was introduced into technical analysis by the world-famous trader, author of numerous books and publications – Scott Carney.
He described this harmonious pattern not so long ago – only in 2000. Kearney, in turn, is a follower and student of the trader who introduced harmonious patterns into technical analysis – Harold Gartley.
Crab – basic ratios
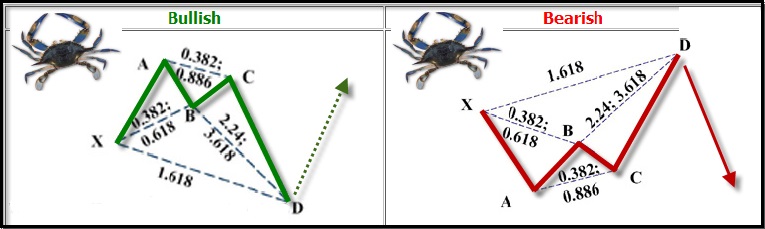
Like most harmonious patterns, the “Crab” consists of five points – X, A, B, C, D. Also, the “Crab” model itself includes another harmonious pattern – AB=CD.
In its form, the “Crab” resembles the harmonious pattern that we previously examined on this site – the “Pesavento Butterfly” or “Ideal Butterfly Model”.
In appearance, they are absolutely the same – for both, with a bullish setup, the highest point is A, the lowest is D, with a bearish setup, the maximum is point D, the minimum is point A.
But there are fundamental differences between these two patterns, namely, the ratio of points relative to Fibonacci levels (they are completely different).
Also, if you look at the model, you can see that the Crab price correction at point B relative to the XA movement is much less than that of the Pesavento Butterfly itself.
Point B, in this case, should be at a level that does not exceed 0.618 of the length of the segment XA!
An ideal Crab pattern is a model that satisfies the following conditions:
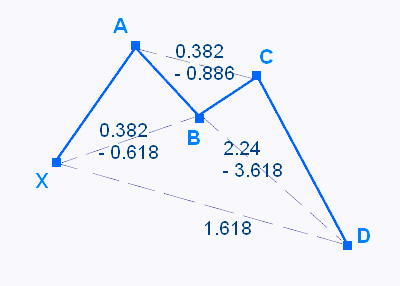
- point B is in the range of 0.382-0.618 of the length of the movement XA;
- point C is in the range of 0.382-0.886 of the length of the movement XA;
- point D is a local extremum and is located at the level of 1.618 of the Fibonacci grid built on the segment XA.
Also, if you study this model in more detail, then you can also distinguish such a type of pattern as the “Deep Sea Crab”.
In form, it is very similar to the usual “Crab”, but its Fibonacci relationships are as follows:
- point B is above the level of 0.5 of the length of the movement XA;
- point D is above the 1.618 Fibonacci grid level, built on the segment XA.
- That is, the right claw of our crab is very much larger than the left claw. The price in it can move for long distances – 314%, 423.6% of the XA movement.
Do not forget that an important property of all harmonious patterns is fractality. That is, in almost any harmonious pattern, you can find another harmonious pattern.
The Crab pattern is no exception. With a decrease in the time interval of the chart, several harmonious patterns can be found.
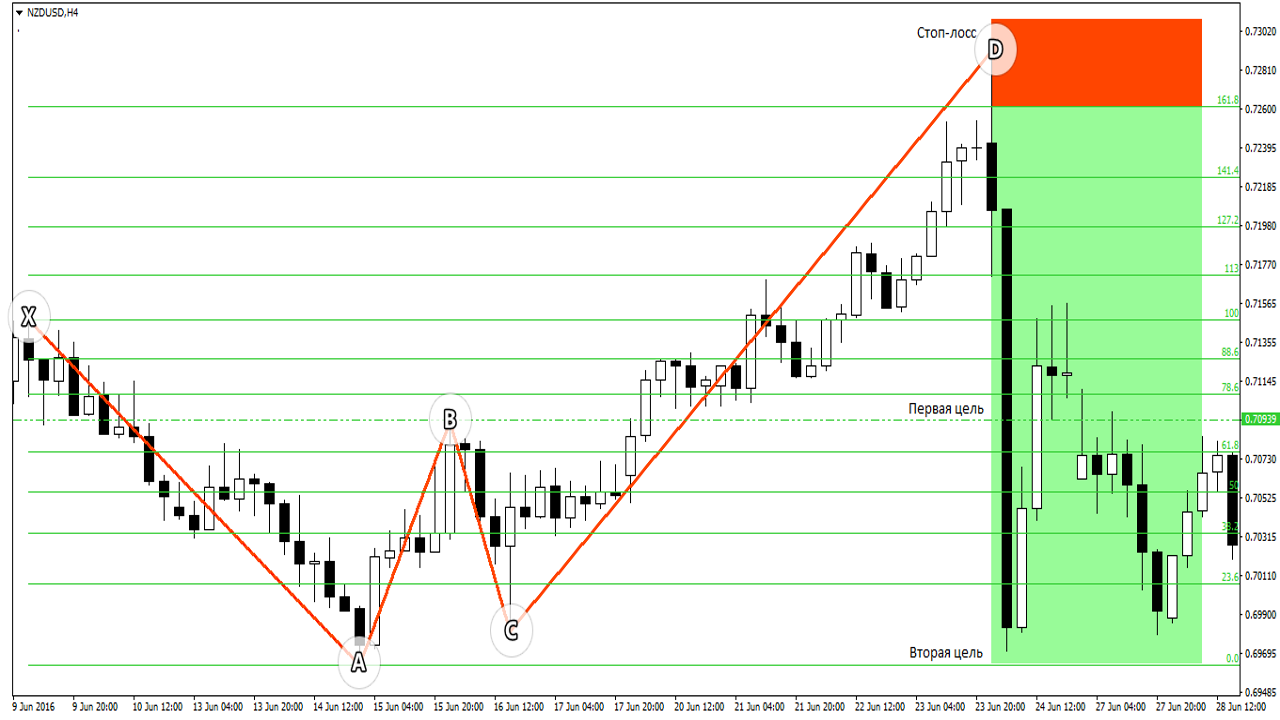
How to trade the Crab pattern – trading strategy:
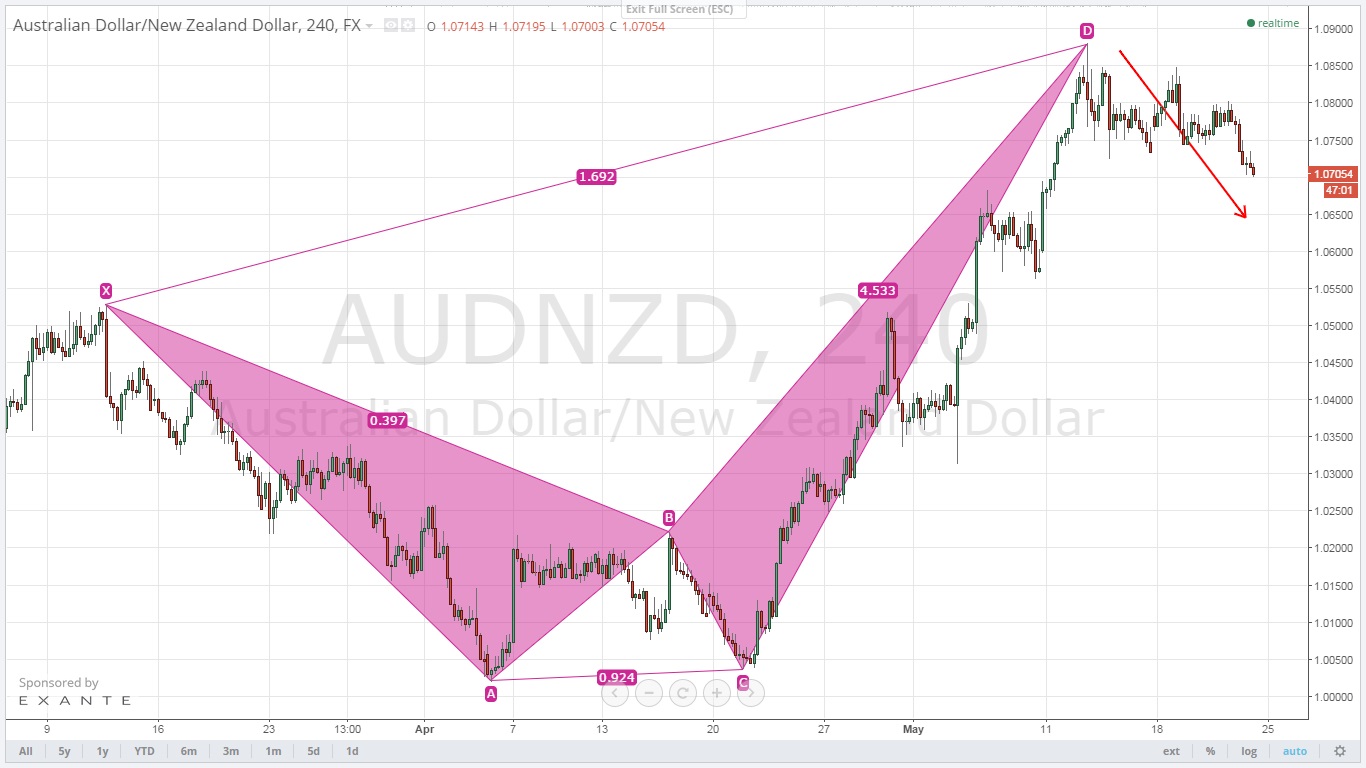
1) First of all, you need to make sure that the ratios of the constructed points of the “Crab” meet the requirements for building the model, which we described above.
2) And after that, make a deal at point D or wait for a rebound from this point and then open an order.
3) Stop loss is placed behind the next Fibonacci level / Fibonacci extension.
4) Profit – maximum / minimum of the model.
That’s all I wanted to tell you about Crab.
![CRAB Harmonic Pattern [Forex & Crypto Trading Strategy]](https://strategy4forex.com/wp-content/cache/thumb/4a/7ea6ae5df9e884a_320x200.png)