Trend strategies are popular among experienced traders, so the ability to draw trendlines becomes one of the tasks that beginners must learn to solve.
This will help them determine the current trends in the market, the presence of a trend and the moments of its change to the opposite.
And most importantly, it will allow you to find very good entry and exit points to the market, without even using indicators, but relying on technical and, in particular, graphical analysis of the market.
Building trend lines
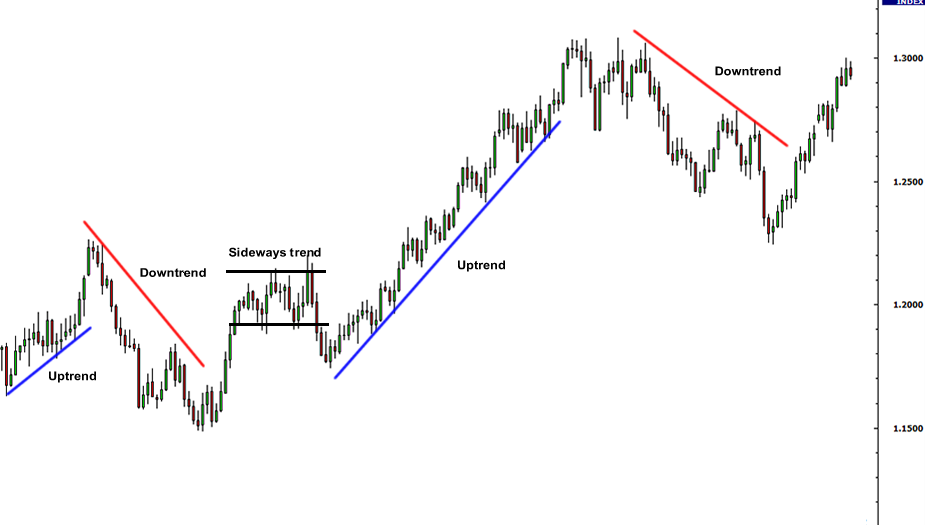
In order to to determine the direction of the trend, you should open the chart in the trading terminal. It is best to navigate by the daily chart, so you need to select the D1 timeframe in the terminal. When you look at it, you will see that the price of an asset never moves in one direction.
Periodically, the chart goes up, then the market goes flat for a while. But it may not be, then after the upward movement, the downward movement immediately begins.
The reverse situation is also true, when a downtrend is replaced by a flat or an uptrend. The drawn trend line is used in the work of specialists, it shows in which direction the price is moving.
The longer the trend is present in the market, the more powerful the reverse movement will be.
For example, at first the asset becomes cheaper every day, the graph goes down. But when the economic situation changes, investor interest in the asset arises. They start buying it, it grows in price.
The chart moves up, approaches the resistance line, breaks through it, and then rushes further. So forms an uptrend. How long it will last depends on the trend in the market, the state of the economy and other factors that affect the value of the currency.
If the price moves in the same direction for several weeks, when looking at the four-hour or daily chart, the trader will notice that a resistance or support line is forming. But in the case when the trend has changed recently, a new movement is just beginning to form, the boundaries have not yet been formed. Therefore, you need to wait for a rollback.
A currency trader must learn to determine where the market is headed.
Trendlines can be drawn as follows:
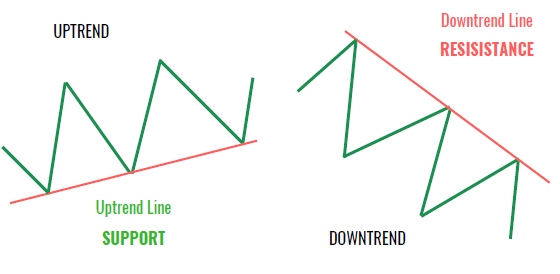
1. If the movement is upward, a support line is drawn along the lows of the chart. Above, parallel to it, there is a resistance line.
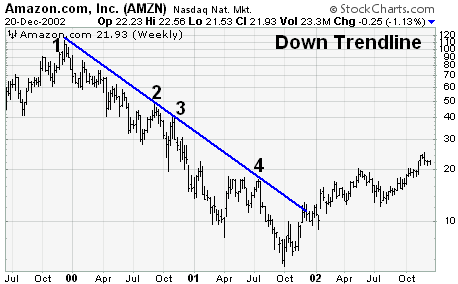
2. When the movement is down, a resistance line is drawn to the maximum, and supports are drawn parallel to it.
3. In case of a flat, a support line is drawn along the lows, and a resistance line is drawn along the highs.
The logarithmic trendline can help, it can be used to understand how trends are changing. Based on the available data, a forecast can be made.
The effectiveness of trend lines
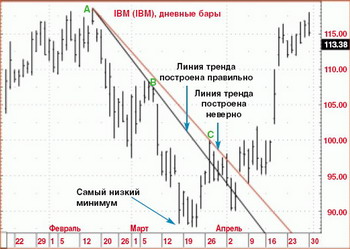
Although it is believed that trend lines can be drawn using 2 points, the more there are, the more stable the resistance level can be called. The same is true for the level of support.
But it happens that the price behaves in such a way that even 2 points for plotting cannot be found. In this case, you do not need to make a drawing, you should wait until the next maximum or minimum is formed.
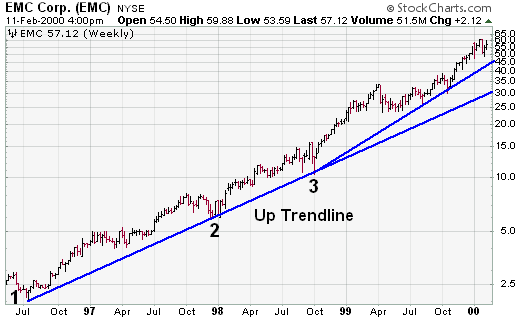
The trend should be clearly defined, so there is no need to invent anything. Novice traders can be guided by the following rule: a line is built using 2 points, and the third should serve as confirmation.
Location of contact zones on the line
Many novice traders are interested in where contact zones should be located. The distance depends on which timeframe is selected. How the price moves matters, and the subjective preferences of the currency trader also affect.
If the extremes are next to each other, a trend line was drawn along them, this does not mean that the forecast is correct. It is necessary to strive to ensure that points 1 and 2, denoting extreme points, are at a distance from each other.
Tilt angle
Traders should pay attention to the angle. The steeper it is, the lines are considered less reliable. If one of them was drawn by highs or lows located far from each other, this does not mean that it was drawn correctly.
Currency traders should take into account that the trend lines are affected not only by the chart itself, but also by how it is displayed. For example, if the monitor is widescreen, the graph will look different than on a 4:3 screen.
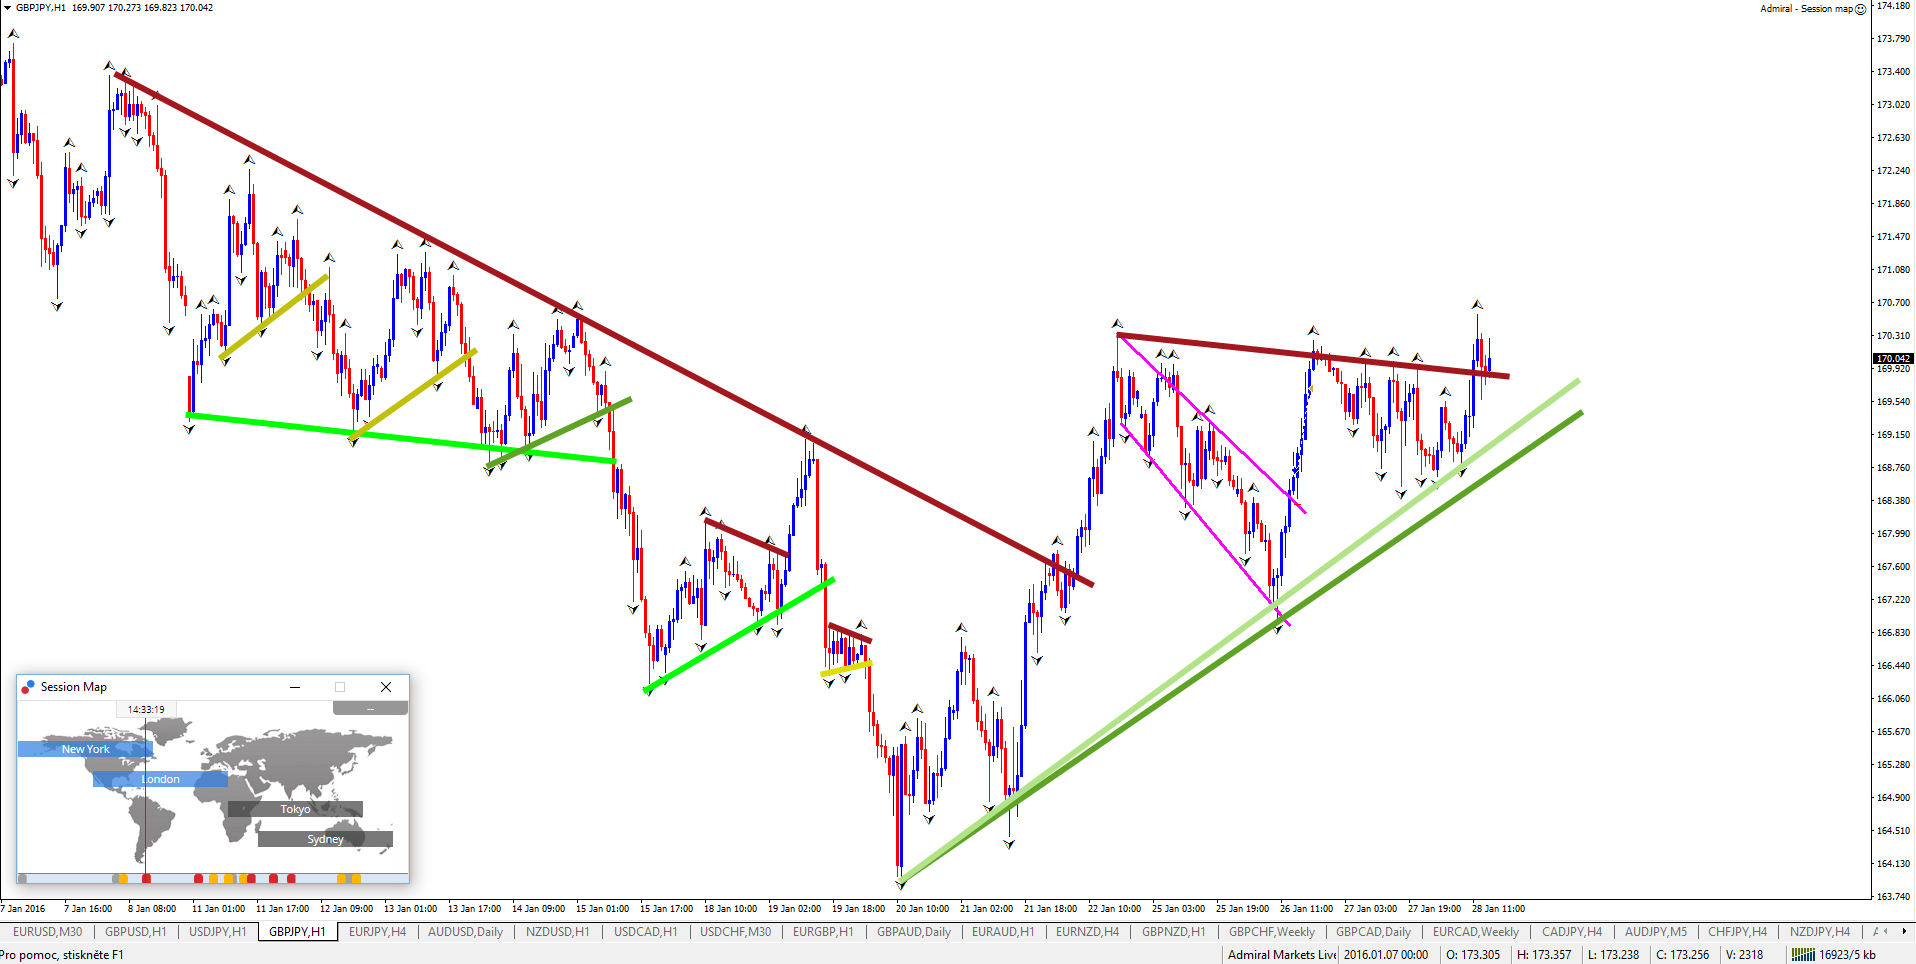
Internal lines
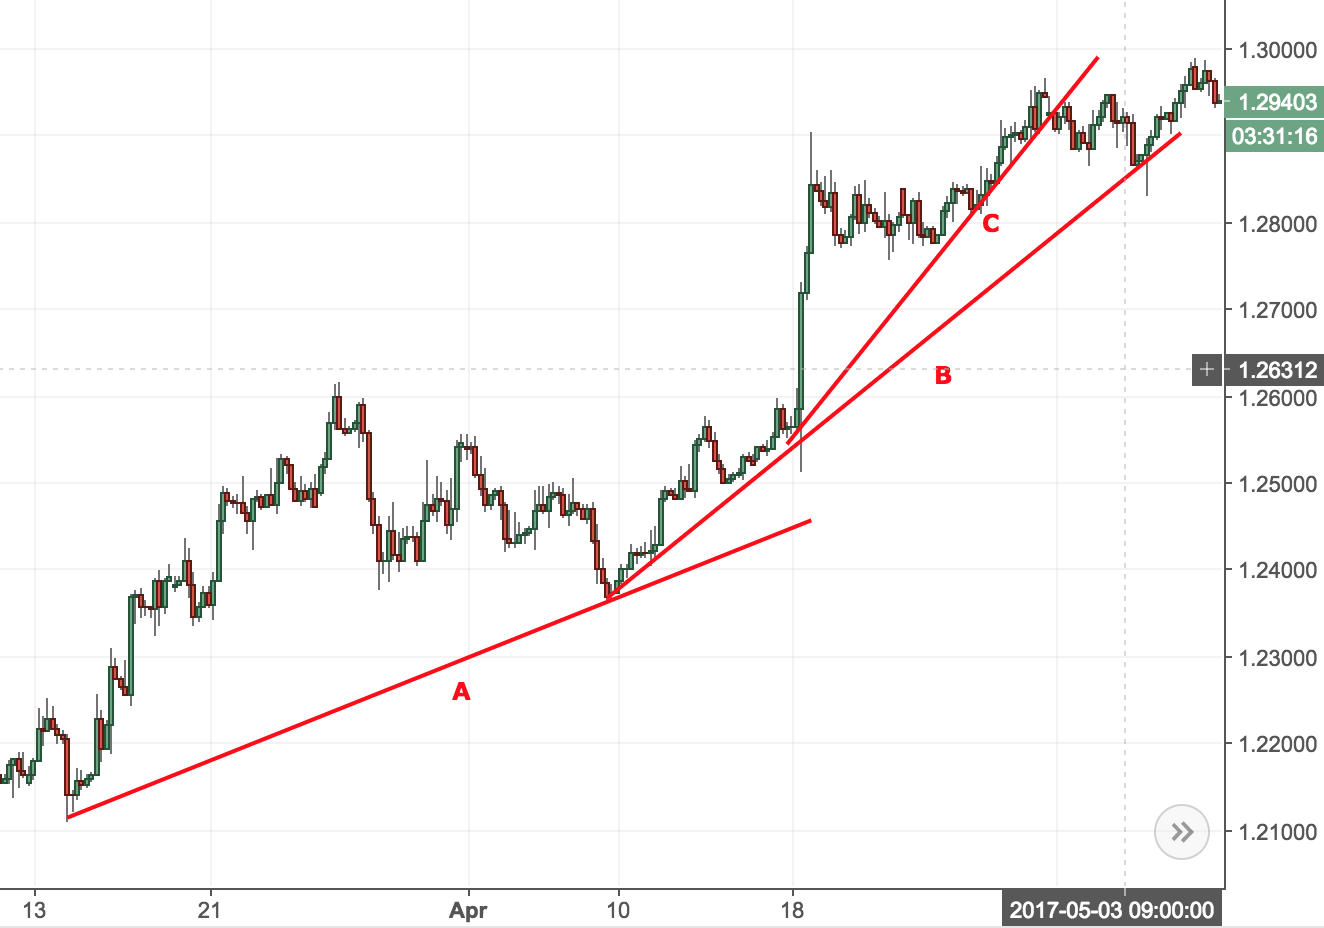
Often beginners, trying to connect several points on the chart, are faced with the fact that it is it is difficult to draw a line on them. They are located above it, then below. This happens when there is strong volatility in the market, the price breaks through the resistance and support levels and comes back. To correctly determine the direction of the trend, additional trend lines are drawn.
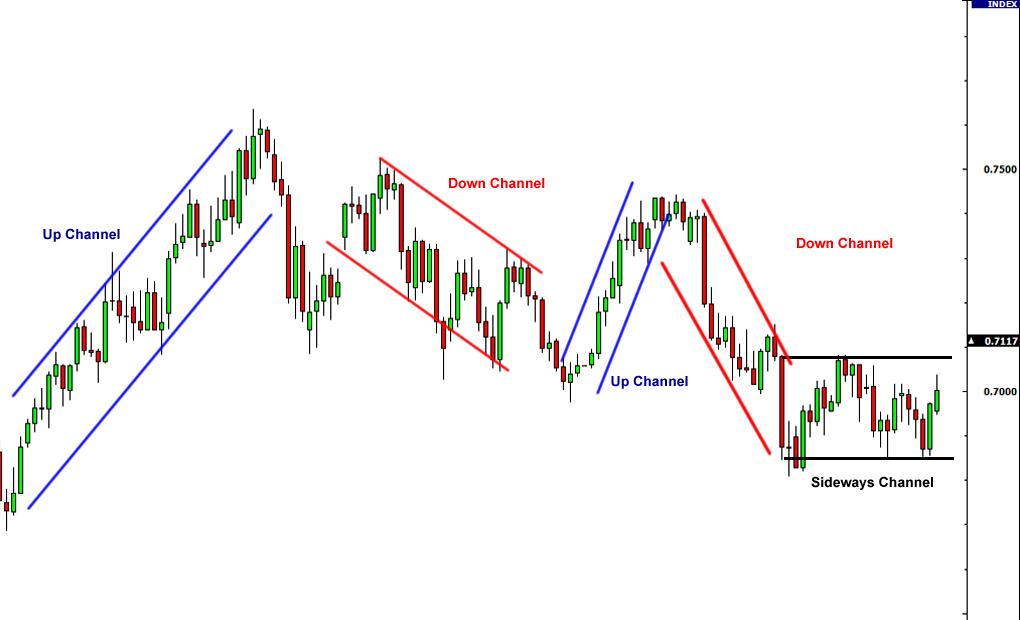
How many lines are needed on the chart
Although traders often use additional lines to determine the direction of movement, do not be zealous by drawing 4-5 lines. The chart should be easy to read, and the boundaries of the channel along which the price moves should be clearly defined.
Trade
To make a profit, a trader needs to know where the market is going.
Trend lines will help him in this, while the trend itself can be of the following types:
- Main. This is a price movement over a period of 1 to several years. Investors who prefer to make long-term investments work on such intervals, but for speculative trading in the market it is better to use other time periods.
- Intermediate. It lasts from 1 to several months, being a correction of the general trend.
- Short-term. Its duration ranges from several days to several weeks. The direction of price movement on a short time interval is the most difficult to analyze, but most of the traders work on such short intervals. The price of an asset is influenced by economic news and events taking place in the world.
You need to start trading with study of currency pairs charts. A trend line can be drawn easily. For it, you need to take 2 points, connect them with a line, and then extend it.
If the trend is up, the chart goes up, with each high being higher than the previous one. In a downtrend, the situation is reversed, and each low is lower than the previous one.
To do this, specialists study the chart, paying attention to the following:
- The longer the price goes in one direction, the more likely it is that the movement will continue.
- It is necessary to pay attention to the angle that forms between the axis and the line. If the trend is strong, then the angle is large. An acute one indicates that the trend is getting weaker, a reversal is possible.
- You need to look at how many times the price bounces from the support and resistance lines. The more, the stronger the dynamics.
- To find out long-term trends, you need to study the daily charts. On hourly or four-hour intervals, short-term and medium-term trends are determined.
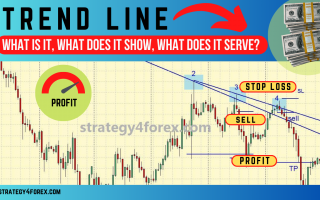
Specialists working on Forex, often trade with the trend, placing a large take profit, periodically buying additional currency. This leads to the fact that the potential profit far exceeds the loss that can be obtained from the stop loss.
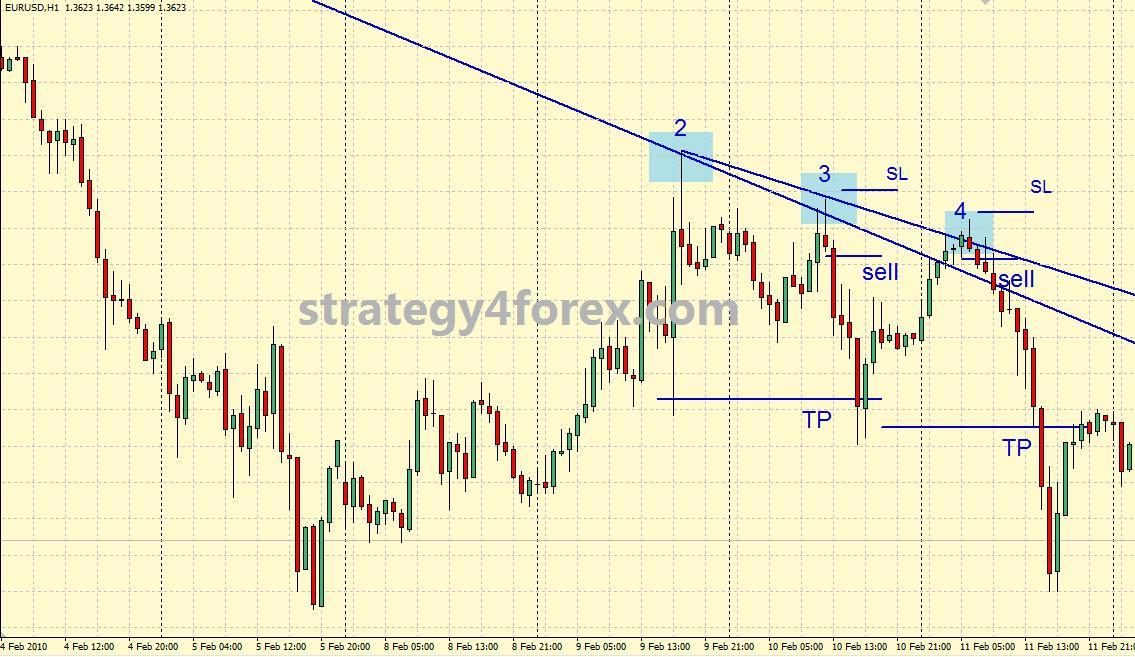
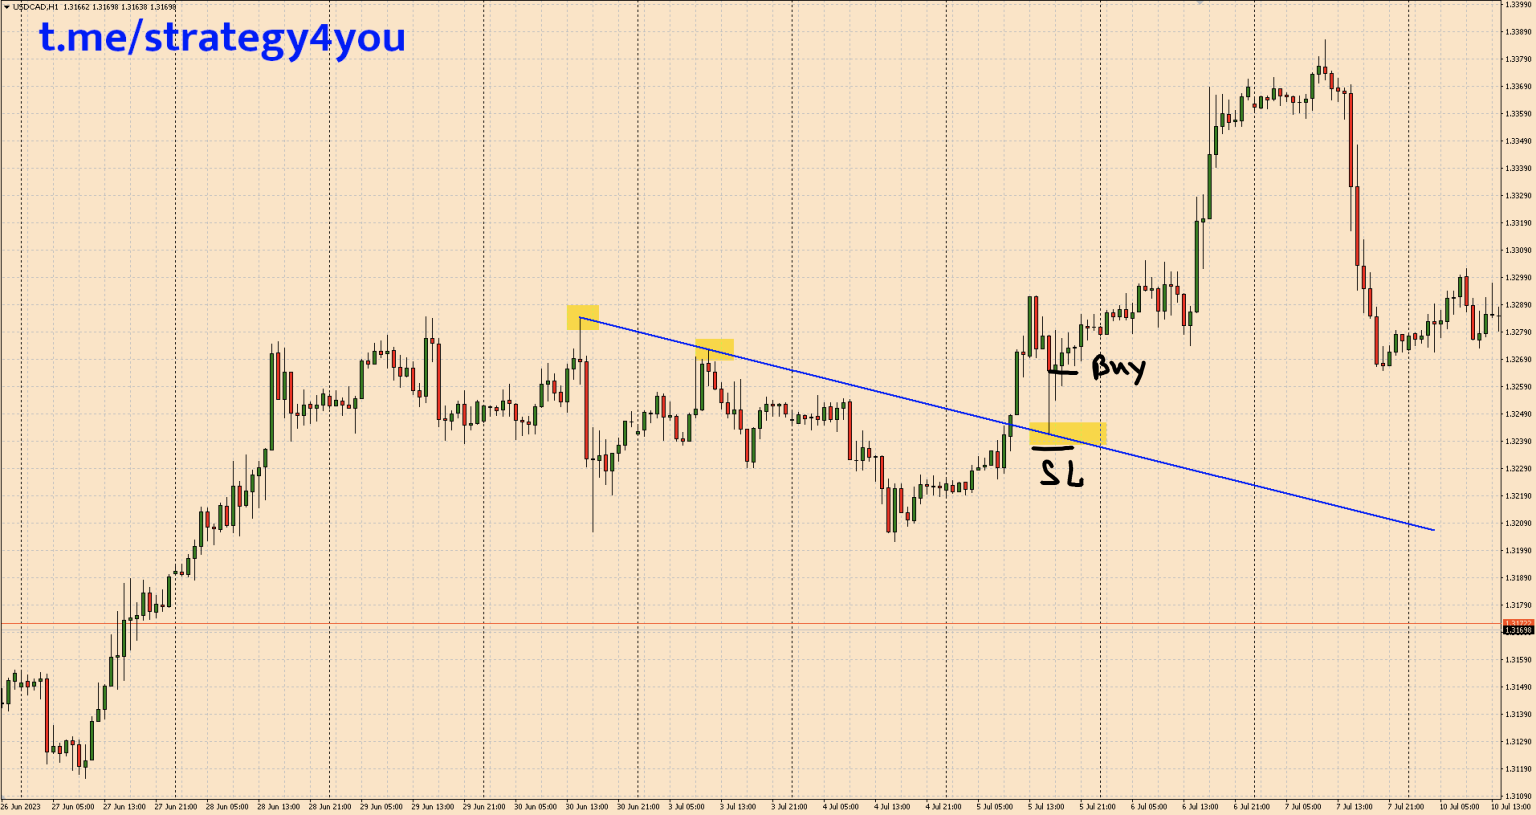
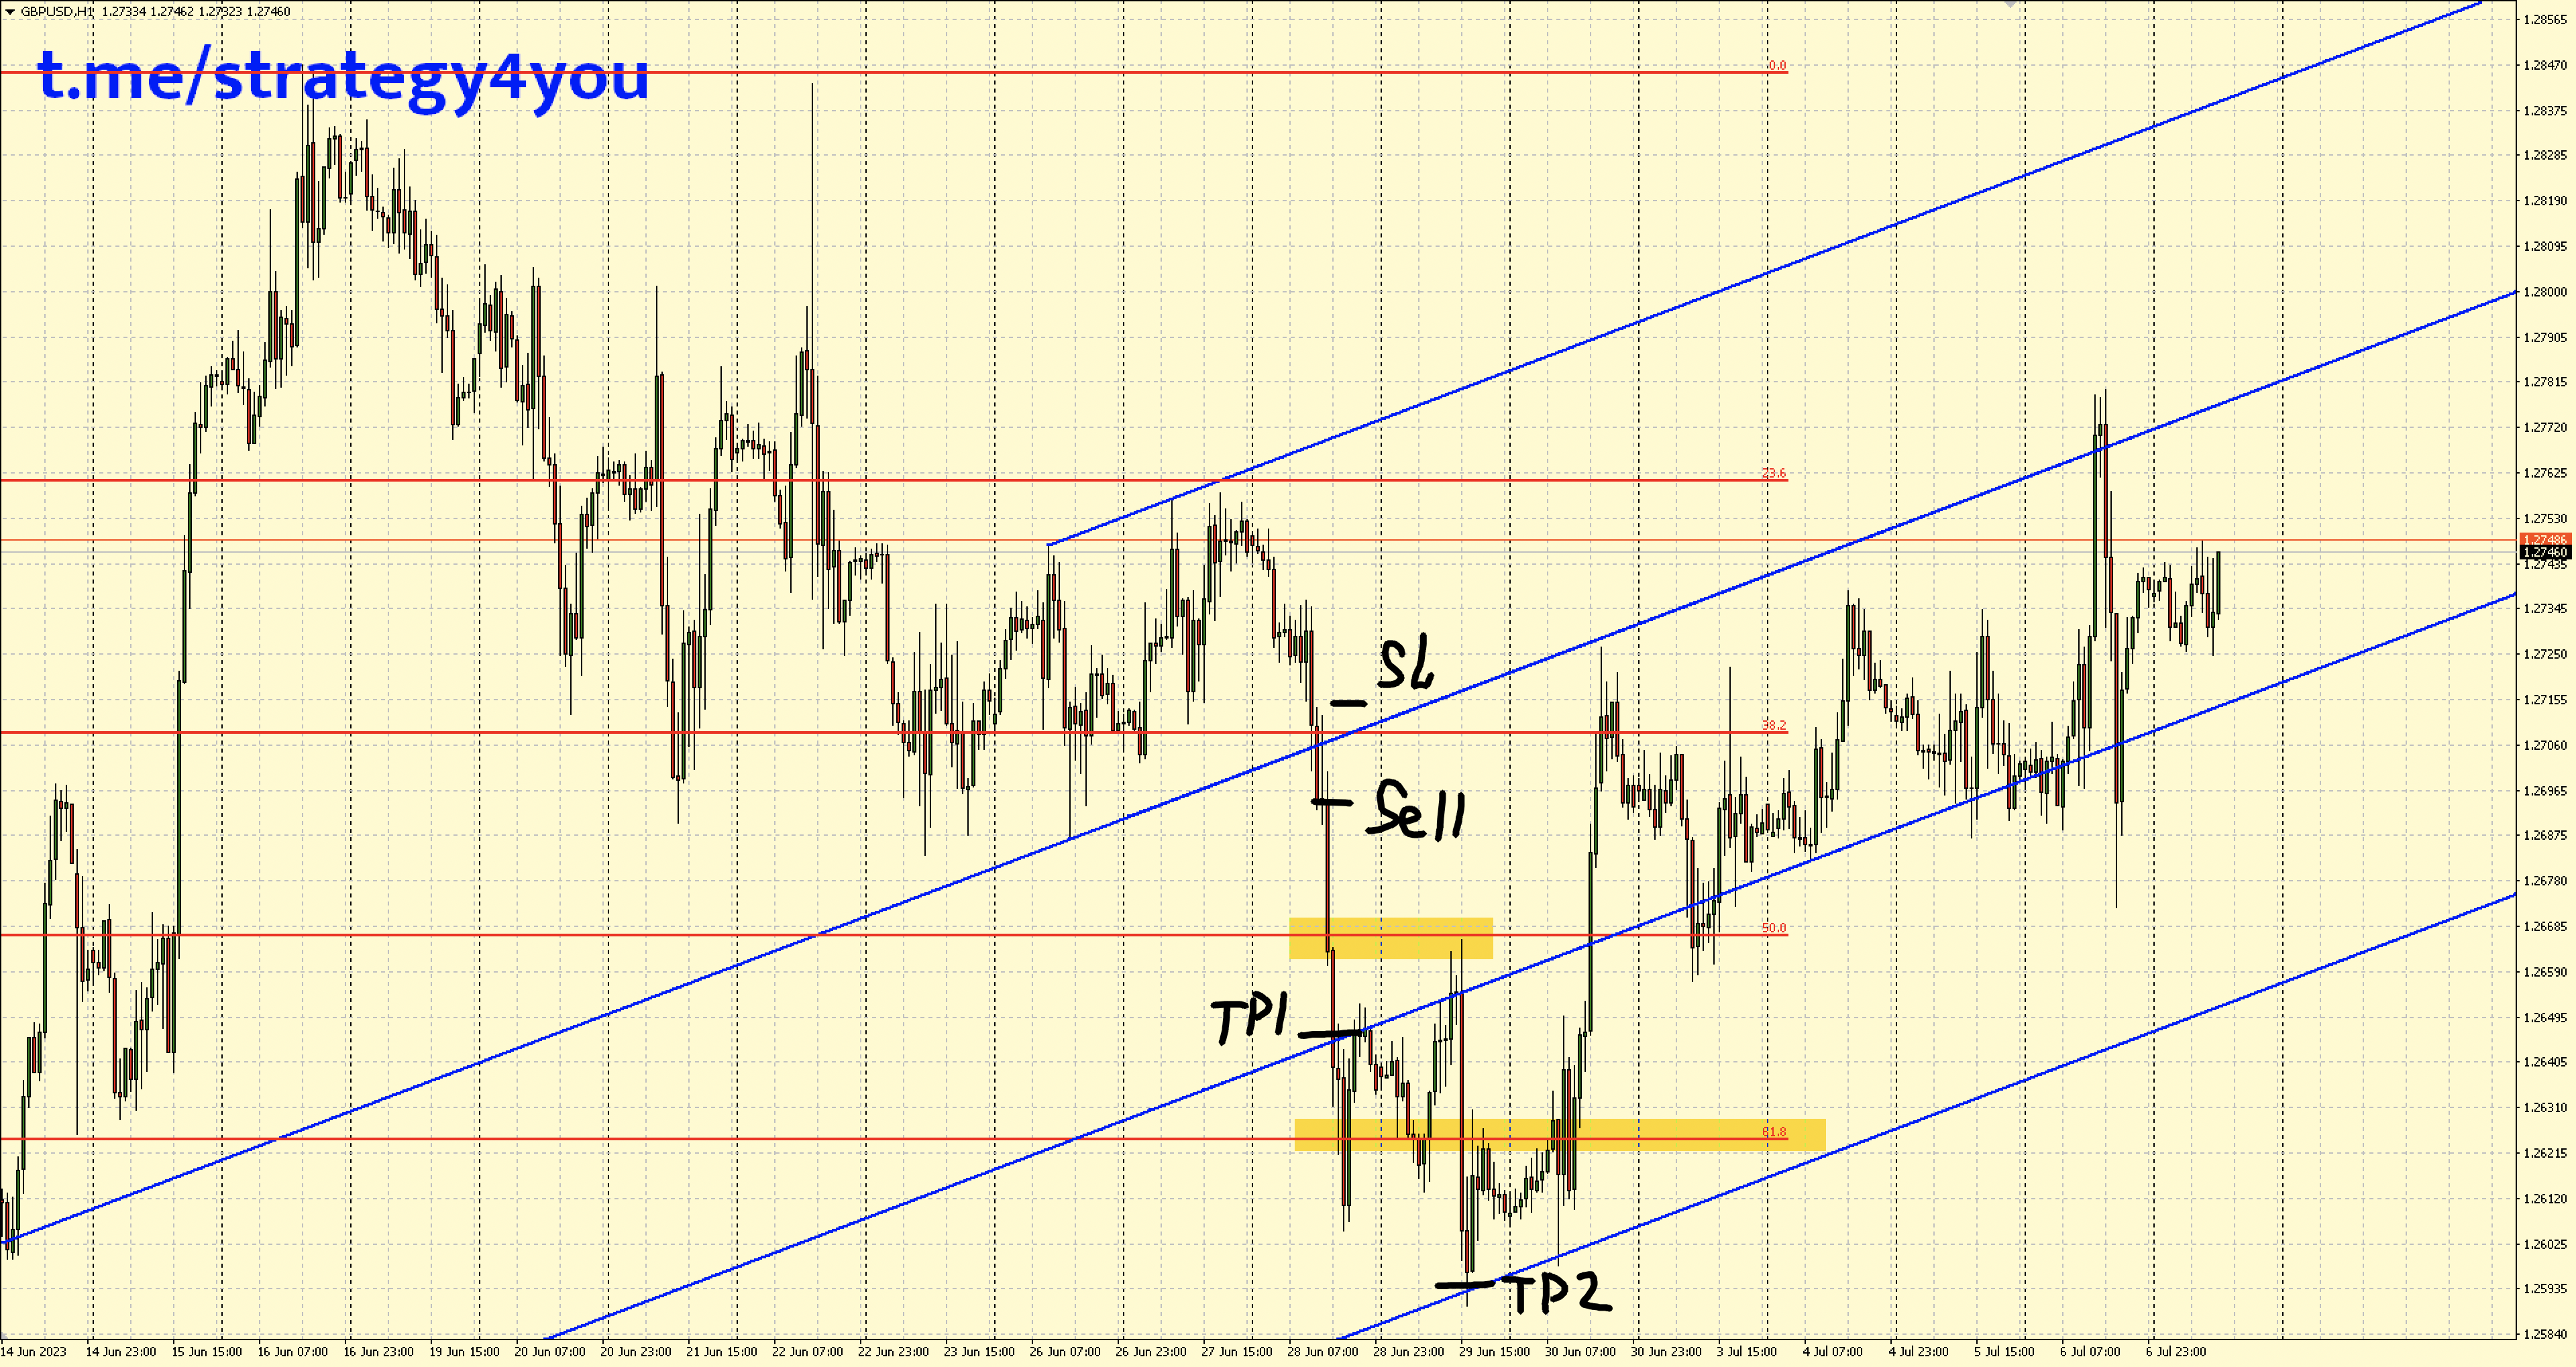
An example of a forex strategy on trend lines:
Line breakdown
If, when looking at the chart, it is clear that will soon be broken, this indicates that large players have entered the market and show interest in the growth or fall of the asset. In this case, you do not need to move against, the easiest way is to trade with them.
Not all beginners understand what is breakout trading. Most of the strategies are classic techniques that have been used for several decades. They are based on the idea that the price, which has been fluctuating in one range for a long time, will eventually break through the level, moving up or down.
But beginners using such strategies have difficulty identifying breakout levels. Noise can interfere with the analysis, so you need to get rid of them so that they do not contribute to making an erroneous trading decision.
It is best to use breakout strategies on those currency pairs that are characterized by high volatility. In work, experienced specialists recommend using timeframes not lower than an hour, but it is better to focus on a four-hour one, then there will be little noise.
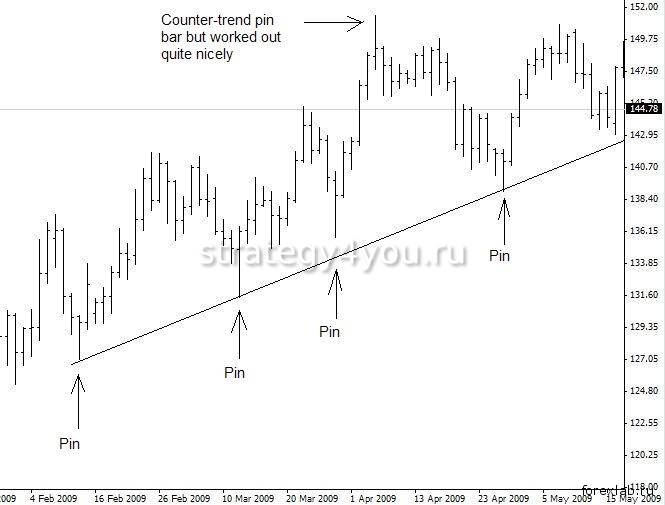
Rebound trading
When sell or buy orders accumulate near a price point, resistance or support levels appear. The price, having reached the border, bounces due to the fact that market participants close orders. Traders use this moment in trading. With the help of Price Action patterns and other tools, you can determine when is the best time to enter the market.
Effective use
Beginners who have only recently started working in the foreign exchange market should not be in a hurry. When determining a trend, you need to be scrupulous, carefully look at where the support zone is on the chart, and where the price has encountered resistance.
It is necessary to see if there were rebounds, in what situations the boundaries of the corridor were broken. It is helpful to write out all the scenarios and then use different methods to confirm or refute your assumptions.
Most often, Japanese candles, Price action patterns are used as confirming methods. It is useful to use indicators, methods of technical analysis.
It is useful to study how the price behaved on different timeframes. On some of them, breakdowns and rebounds can occur more often, while on others – less often. It is worth studying the economic calendar. With its help, you can find out if the news came out at that moment, what impact they had on the currency.
Many traders use indicators in their work, but you don’t need to mindlessly drag them onto the chart. Before you start working with them, you need to test them. This is necessary so that the trader knows whether he can make the correct forecast with their help.
Beginners should understand that there is no single method that can be used to determine how the price will behave in the future. No one knows if the candle will break the level or bounce. One can only guess how events will develop, and then plan their work.
To better understand what is happening in the market, you can use technical analysis. There are many techniques that will help novice traders determine in which direction the price is moving.
Practice lines
Most beginners who start working in Forex lose money. They rush, ignore the basics. Correct definition of the trend becomes a guarantee that a novice trader will be able to make money on the foreign exchange market.
Professionals in their work do not use complex strategies so much as make money on basic things. Therefore, a beginner should focus on learning how to correctly determine where the price is moving.
Each tool that will be used in the work must be studied. Experience comes with practice, so you need to train, draw trend lines (and our free lessons in this section will help you with this) until you become confident in your actions.