Bollinger Bands were invented by John Bollinger in the eighties has 20 centuries and were once the most commonly used tool when using technical analysis. At the heart of the Bollinger Bands — three lines — the upper, middle and bottom. And they are used to identify extreme price values trading tool.
What does the «data strip?
The upper Bollinger band — this is nothing more than a territory overbought trading tool, the lower-oversold territory sales tool. For a more qualitative picture of the market and uses this indicator — Bollinger, but often it just used in conjunction with other indicators!
But to start propose to consider it separately from the others and to build the most simple strategy trading forex based on it. Bollinger bands are standard indicators of the trading terminal Metatrader 4.
To install it, go to the menu and choose MT4 — Insert / Indicators / Trends and activate the indicator — (Bollindger Bands).
The essence of a simple forex strategy on Bollinger Bands:
Buying the breakout of the lower band indicator Bollinger — it’s a good way to use oversold in its strategy. Very often, when the lower band is penetrated with a large sales force, the price of a financial instrument returns back above pierced the lower band, and then comes to the middle Bollinger Band. That’s how we try to make a profit by using this indicator.
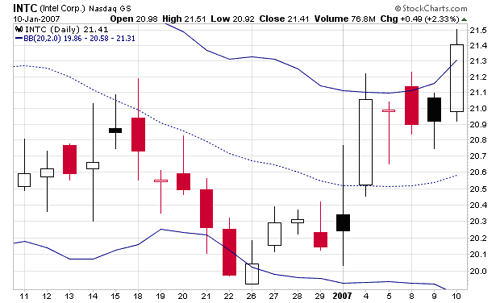
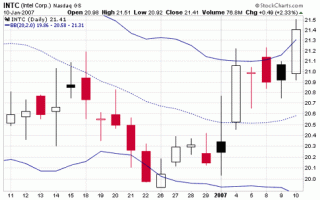
Consider the example 1 on the chart of the company Intel Corp. (INTC):
Below is an example of the system under ideal conditions.
Figure 1
Figure 1 shows us that on 22 December Intel shares have punched the bottom bar indicator Bollinger and closed below this line. And it gave us an unequivocal signal to indicate the fact that the action came in the oversold territory.
Our most simple strategy based on an indicator Bollinger Bands expects close below the lower band, and immediately thereafter, the next day, according to her — should purchase the asset. This choice has led us to a great deal. December 26, after opening the bidding, became the last day when shares of Intel were trading below the lower Bollinger band. And it is from this date the shares of Intel have gone up, and even went above the upper Bollinger band indicator.
Consider Example 2 — New York Stock Exchange (NYX):
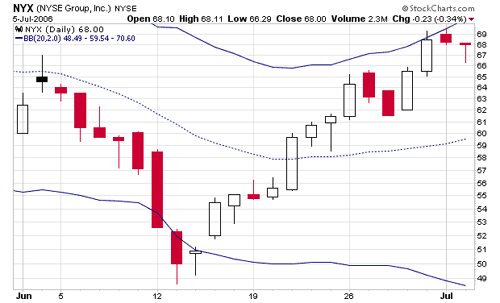
Another good example of successful use of this system you will see on the chart of the New York Stock Exchange as soon as it June 12, 2006 broke through the bottom bar indicator Bollinger
Figure 2
Tool NYX was oversold. Following the trading system, the trader will deliver an order to buy NYX in the market opening on June 13. The next day trading tool NYX again closed below the lower Bollinger band indicator, which probably caused some concern for some market participants, but it was the last time before the end of the month, when the action is so close.
It’s a great script that trading strategy hopes to catch. In Figure 2 we show the situation on the market, when the number of offerings has been extraordinary and, as Bollinger bands are able to adapt to the market situation, on June 12 was noted as the date of the most abundant sales. Opening a trading position on June 13 allowed traders to enter trading just before the turn.
Consider the example of a 3 — Yahoo Inc. (YHOO):
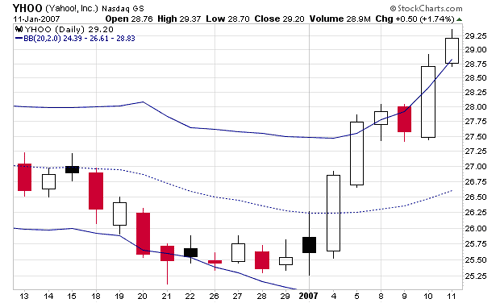
In the following example, Yahoo shares broke through the lower Bollinger band on Dec. 20, 2006 The strategy of trade demanded a quick purchase of these shares at the opening of the next trading day.
Figure 3
Exactly the same as in the previous example, the company’s shares under pressure salespeople. In the hour when most traders are still selling this isntrument, our strategy calls for us a buy signal. Breakthrough of the lower Bollinger band indicator reports the status of the oversold market. And the signal was correct, how do some Yahoo shares soon unfolded. December 26 shares of Yahoo again tested the lower boundary, but did not close below it. The moment was the last time of testing, the lower band of Bollinger Yahoo, because later share went up, reaching the top of the bars.
Bollinger bands downward movement:
It’s no secret that every trading strategy has its advantages and disadvantages, and this too is no exception to the rule. In the following examples, we show limitations of the trading system and what can happen when the market does not develop for our planned schedule.
Once the strategy is making mistakes, the bars continue to break through, and you suddenly notice that the price continues its decline, moving along with the downward Bollinger. And do not pity, but the price does not retrace back soon, which may cause our account to a substantial loss in trading. Ultimately, this strategy often turns out to be right, but a large number of traders are not able to withstand market decline that may occur before the correction.
Consider Example 4 — International Business Machines (IBM):
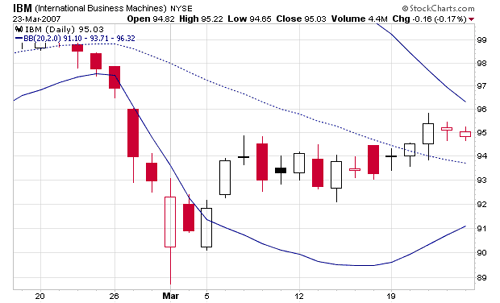
For example, February 26, 2007 IBM shares closed below the lower Bollinger band indicator. Selling pressure has led this rally in oversold territory. Trading strategy recommended to buy this share at the opening of the next trading day. Like the previous examples, the next trading day the market began to fall during the day, but this case was unusual — a large number of offerings made this action very powerfully to go down. Sale of the shares continued after that day, when our stock was bought and the price closes below the lower band within the next 4 trading days. But finally, March 5, the selling pressure was exhausted, and turned around, the action again went back to the middle Bollinger Band. But regrettably, to this point has already been recorded a loss on the trade account.
Figure 4
Consider Example 5 — Apple Computer Inc. (AAPL):
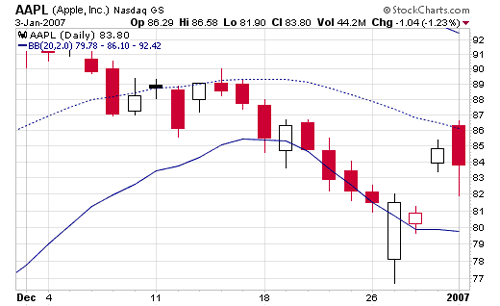
In the following example, Apple’s stock closed below the lower Bollinger band 21.12. 2006.
Figure 5
Our strategy is required to buy Apple shares on December 22. The next day trading stock made dvidenie down. The influx of further proposals to sell the shares continued to drop the price down to Toch long as she showed us an intraday low of $ 76.77 (much more than 6% below the level of inputs) in just 2 trading days after the opening of the position. Eventually, on 27 December of correction, but for most traders traders who were not able to withstand short-term fall by 6% in two days, this correction has brought very little joy. This was the case when sales continued into oversold territory. In times of such sales, there is no way of knowing when they end.
And so what we learned:
Trading strategy to use the lower Bollinger band indicator, as the definition of oversold market, proved to be correct. These conditions led to the correction of emergency stocks in the opposite direction to the middle lane indicator Bollinger.
But there are situations when the trading strategy is correct, but it sailed wide offerings still continues. In such situations there is no way to know when the selling pressure will come to an end. So when it was decided to conclude a deal to buy, in the case should join some sort of protection. In the example, with shares of NYX, they are well risen only once closed below the bottom line indicator Bollinger in the 2 nd time. Trading strategy in this transaction was not a mistake.
And shares of Apple, and IBM shares behave a little differently — they do not have to come back after breaking the lower Bollinger band. Instead, they succumbed to further enhance the selling pressure and fell along the bottom of the bars. Very often it can cost very expensive. In the end, and Apple, and IBM are still deployed, and it proves that the strategy of trade still holds. And not ordinary, but the best way to protect against loss trades related to the fall of prices along Bollinger, is to use a protective stop-loss.
Summary of results on trading strategies on Bollinger Bands:
Buying at the break of the lower band indicator Bollinger — davolno simple trading strategy, which often works well. In each of these scenarios breakthroughs lower Bollinger band occurring in the oversold area of the indicator. The timing of the trade deal are likely to become a big problem. Stocks that break through the bottom bar indicator Bollinger and entering at the same time in oversold territory, faced with high pressure salespeople. This influx of proposals bears are often quickly corrected. As soon as this pressure drops, the shares continue to make new lows in the price chart, while being oversold. In order to effectively use this trading strategy, you need a good tactic out of position. Foot — this is the best way to protect your account from falling stock prices along the lower Bollinger band and new lows.
This is a simple example strategy trade Bollinger Bands and published to explain the main essence of this indicator, and in the future on this site will be considered a more advanced strategy that applies to the FOREX market to trade with Bollinger bands.

