Forex Strategy “Inside Day Bollinger Bands” is designed for traders who trade only on the trend, so that they can earn large sums of money in just a few prisoners of profitable trades, but you still want to accurately identify trend reversals.
But, in practice, to apply trade with the trend is much harder than it looks in the study of theory. Therefore, all that we need for successful trading – is the maximum and minimum, as well as an effective filter, which helps to identify the transaction at the top and bottom.
This forex strategy, we consider the “inside day Bollinger bands, which tends to help objectively determine what is the maximum, and that – at least.
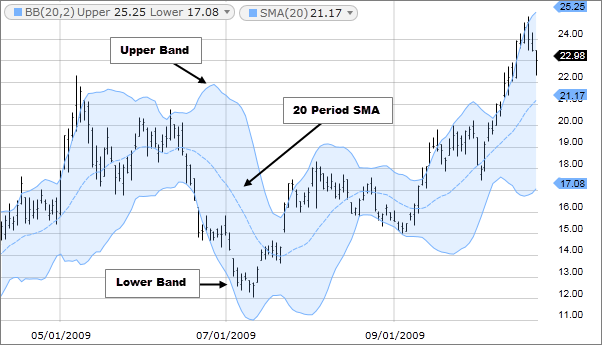
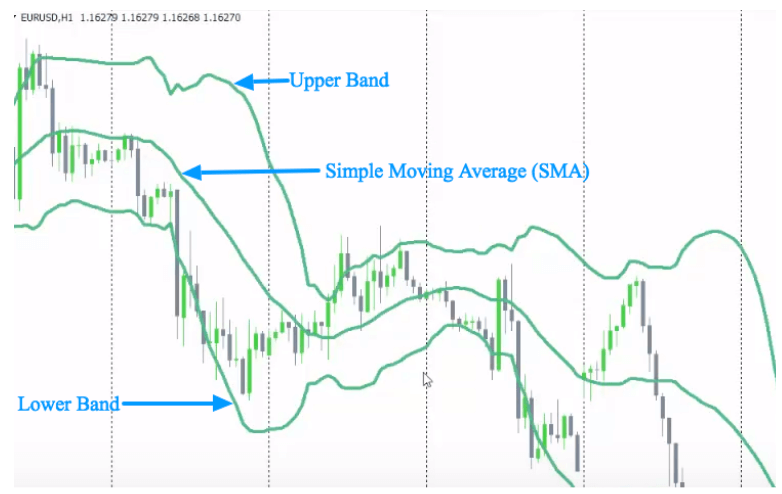
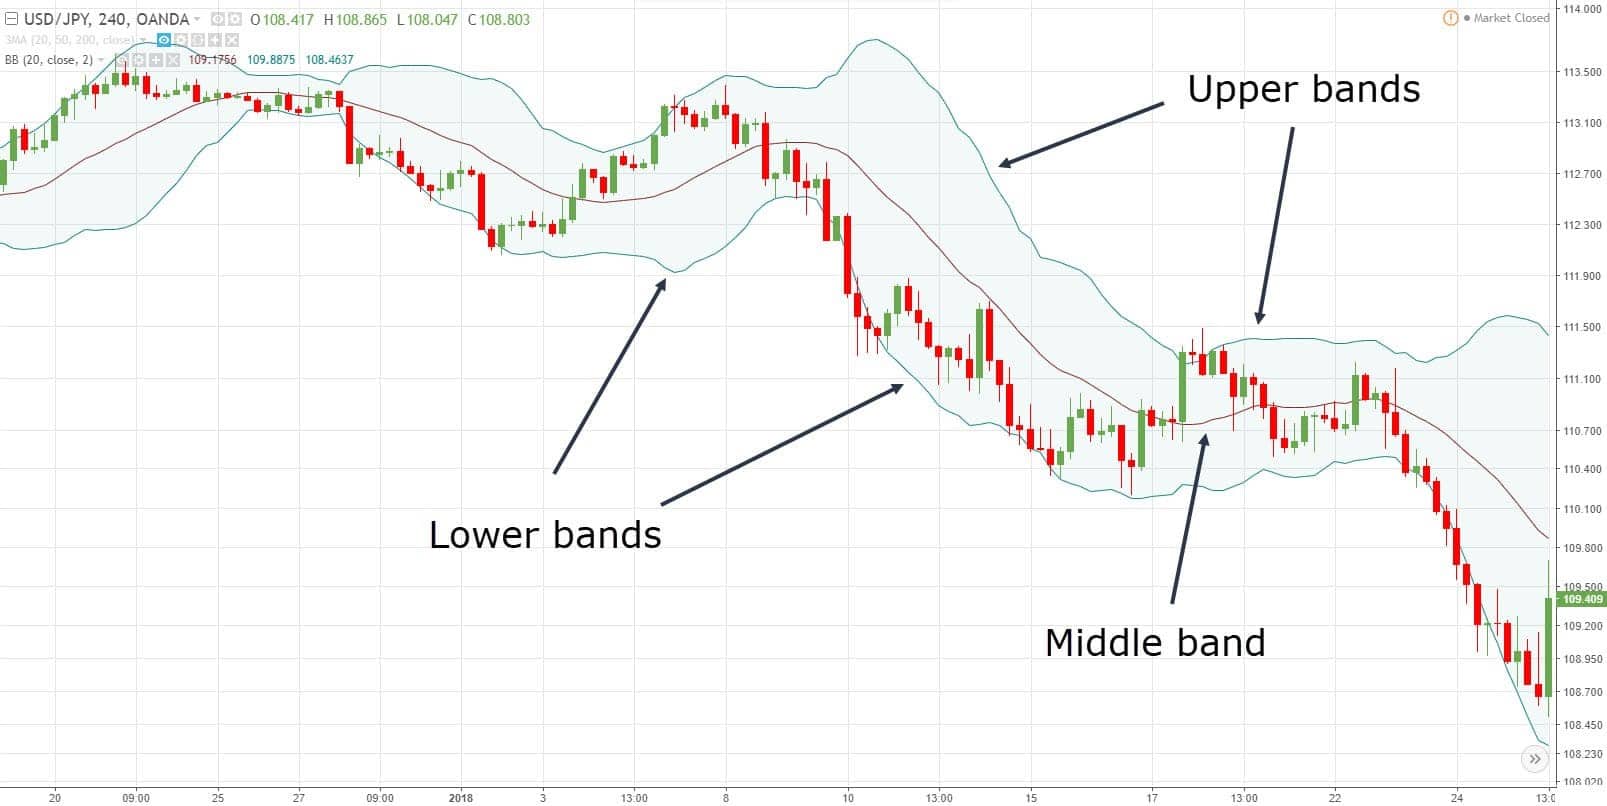
Trading on Bollinger Bands
When trading on Bollinger – it is believed that the price is near the upper Bollinger band inidkators considered high, and the price at the lower Bollinger band indicator is considered low. But the mere fact that the price reached the upper Bollinger band, does not mean that it is time to sell. Sufficiently strong trends can ‘move’ on the strip and “eat” any deposit forex trader who tries to buy ‘low’ prices in a falling trend, or make deals to sell at ‘high’ prices on an uptrend.
Therefore, our filter must ensure that the trading signals generated by the purchase only if the candle after the one that came into contact with Bollinger, fails to comply with a new high or new low. Here are a type of candle is often called, “a candle inside day.”
The best time interval to search for “candle inside day” – daily charts (D1), but this forex strategy tends to also be applicable to hourly, weekly or monthly charts. Promptness “internal Days” with strips of indicator Bollinger increases the chance to predict the top or bottom, after the price has reached its extreme level. Generally, the larger time scale, the less will emerge such signals, but they will be much more significant.
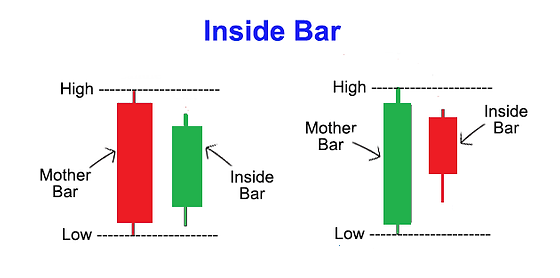
Candlesticks and their patterns represent to us the psychology of the market in this one point at a time interval. Of course, the “inner candle” represents a range of low volatility. If in an uptrend market volatility starts to decline, and the price is not able to show a new high (about what we said and a candle inside), then we certainly can conclude that the strength of the trend decreases and there is a chance for a reversal in the market.
Connecting with the band indicator Bollinger, we thus ensuring that we are going to trade a reversal, concluding a deal to sell at high prices (the upper band is an indicator Bollinger), or to conclude a deal to sell at low prices (lower band indicator Bollinger). Thus, we conclude a deal with a large probability of a reversal of the market – which gives us a chance to get a great return on forex.
- This forex strategy to use Bollinger bands with a simple moving average and period 20 (SMA 20).
- Template for MetaTrader 4 – Inside_Day_BB_tpl (arhived).
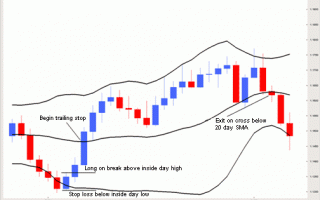
To take a big price move, let the currency pair to go through the 20-period SMA, and only then move your stop loss with a moving average, closing a bargain at the close after the currency pair to re-cross the SMA. To understand – see the examples below.
Rules for the conclusion of the long trading positions on forex strategy “inside day Bollinger bands”:
1. Choosing a currency pair, which reached a very close to the lower Bollinger bands.
2. We are waiting for the closure of the next candle and make sure that the minimum is higher or equal to the minimum the previous close of the candle, and the maximum is also less than or equal to the maximum of the previous closed candles. If these conditions are satisfied, then open a buy position on the opening of the third Japanese candles.
3. Initial stop loss should place a few points below the previous low close of the candle.
4. Reposition the stop-loss after the close of each new candle on the 20-period simple moving average SMA.
Rules for making short trading positions of forex strategy “inside day Bollinger bands”:
1. Select the currency pair, which reached a much came close to the upper band of indicator Bollinger.
2. We are waiting for the closure of the next candle and make sure that the minimum is higher than or equal to the minimum the previous close of the candle, and its maximum is also less than or equal to the maximum of the previous closed candles. If all conditions are fulfilled then, we conclude a deal to sell at the opening of the third candle.
3. The initial stop-loss have a few points above the high of the previous closed candles.
4. Reposition the stop-loss after the close of each candle on the 20-period simple moving average SMA.
Consider some examples:
1) deal to sell the currency pair EURUSD on a daily interval. Fig. 1, we observe that the price reached the upper Bollinger band, and then we need to wait for the day of the internal (to the maximum and minimum of the candles were not higher than the previous bar).
When we waited, then at the opening of the next bar – 21/03/2006 year, open trading position to sell at 1.2144. Next, we move the stop loss based on the movement of the 20-period moving average SMA. The deal was eventually closed 24 March 2006, at a price of 1.2035, with the profit 109 points.

Figure 1
2) a short trade on the currency pair GBPUSD. In Figure 2 we see the same scenario as with pridyduschey deal on the currency pair EURUSD, but in this case was more lucrative deal. Our deal has been opened for sale at a price of 1.7714, 31.11.2005. And closed for 1 December 2005 at a price of 1.7310 with 404 points to earn profits.

Figure 2
3) Currency pair USDCAD, which gave us the opportunity to see the inside day Bollinger bands at 03.06.2006 year. We had a deal to purchase at a price of 1.1364. Upward trend did not last much, not enough – for a whole month, so that closed the deal at a price of 1.1618, 5 April 2006, with profits earned 254 points.

Figure 3
Based on the examples you may have noticed that out of the market can certainly improve profits by closing an open transaction on the other Bollinger band. For example, in a transaction in the currency pair USDCAD, shown in Figure 3, we can close the earnings on March 20 at the upper band indicator Bollinger, priced at 1.1680.
To close the transaction at favorable prices, one would have to trade with 2 lots and take profits on 50% of them – ie one on the opposite Bollinger band on the opening. Swap stoploss second lot of 20-period moving average SMA (described in the beginning). Thanks to such tactics, you’ll close the income for good prices, but it still leave yourself a chance to take a good trend.
Long-Time Graphics:
Installation inside day with Bollinger bands tend to also be applicable to the identification of significant turns on the weekly (W1), or even monthly (MN) charts for long-term trading positions. The following examples show the trading signals our setup at the top of the currency pair GBPUSD (weekly price chart) in Figure 4. At the bottom of a currency pair EURGBP (weekly price chart) in Figure 5.
Good trading signal to buy at the bottom of a currency pair EURUSD at the end of 2000 at a monthly price chart – you may be seen in Figure 6. And finally, the trading signal to sell USDJPY currency pair in Figure 7, in February 2002 at a price of 133.36 on the monthly price chart. In the latter case the currency pair has been closed at a price of 119.49, only four months after opening!


Figure 7
In forex strategy “combinations inside day with Bollinger bands”, there are lots of advantages. More obvious to everyone – it does not apply its simplicity. In this strategy, forex, we can easily measure your risk for each transaction and place the appropriate stop-loss.
Terms of the strategy is dynamic, which means that it works at all time intervals. Even intraday trader tends to use it on the hourly price chart. But, remember – the shorter time scale – the less reliable is the trading signal.