Forex Strategy “Supporting candle” based on candlestick patterns – “Hammer” and in the levels of support and resistance prices (reference level) – Pivot (Pivot);
1) Pattern “The Hammer” (hammer)
And so an ideal pattern of “hammer” can be identified by the following characteristics:
1. “Tail” of the candles (the lower or upper shadow), at least 2 times should be longer than the body itself candles and the top of its shadow.
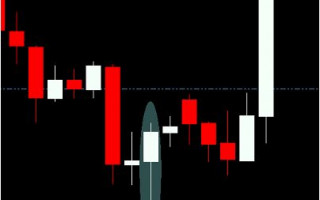
2. “Hammer” is at an important level of support or resistance.
The figure shows an example of a “hammer”:

In the figure below – an example of “inverted hammer”:

2) Pivots (reference level):
Reference levels are usually working as a magnet for the price of the financial markets. The price is very often slow down or completely stops at the “reference levels” before they resume their further movement.
Daily reference rates are calculated on the closing prices the previous day by the following formula:
- Central reference level (pivot) – (P) = (High Low Close) / 3
- Resistance level number 1 – (R1) = 2xP – Low
- № 2 – (R2) = P (R1 – S1)
- № 3 – (R3) = High 2x (P – Low)
- Level of support for number 1 – (S1) = 2xP – High
- № 2 – (S2) = P – (R1 – S1)
- № 3 – (S3) = Low – 2x (High – P)
For the weekly pivot points – all the same, only needs price of the previous trading week, rather than the previous trading day.
But for convenience, we do not expect the pivot levels according to the formula, and ready to use indicators forex trading (you can download them at the end of forex strategy).
3) Trade entry and exit signals for the forex strategy “Supporting the candles”.
This trading strategy is used at intervals: M15 and H4.
At the 15-minute interval should be used daily pivot points (Pivot point). A 4-hour intervals used weekly pivots.
Entering the market for forex strategy PivotCandle:
To enter the market for BUY must be made 3 conditions:
1) Price is above the exponential moving average EMA (20), and she in turn breaks above the EMA (50).
2) Price has broken any of these pivot levels: S1, S2, S3, P, R1, R2 or R3, and returned again to him the same.
3) was formed “hammer” (“Hammer” is already closed).
In the example below, the variant of the interval H4 (a weekly pivot):

If all conditions have been fulfilled – we open a trading position to buy at the market price of 3 lot (or respectively 0.3 and 0.03 – for micro-accounts or accounts forex cent).
Safety stop-loss orders must be placed by 10-20 points below the minimum (the tail), the resulting “hammer” or under the EMA (20) (5-10 points).
Trading signals out of the market:
1) Closing of one lot of the trading position (or 1 / 3 of the open position) as soon as the price goes toward the open position a distance equal to the value specified stop-loss.
2) For the remaining 2 lots of safety stop-loss move under the mean EMA (20) (5 or 10) points as you move up the closing price on the trading position of the stop-loss in the positive area.
For transactions on sale – the opposite rule.
On the example can be seen where it was closed on 1 st Lot:

Closing the remaining 2 open lots.

- Download forex indicator for Metatrader 4 – PivotWeekly.mq4 (used at intervals up to W1)
- Download forex indicator for Metatrader 4 – PivotDay.mq4 (only used at intervals to H1)