Fibonacci is a very popular technical tool in the Forex market. His popularity rose after traders held a series of experimentation with his mystery math and found quite a few advantages of this method.
Five major ways of trading on Fibonacci levels.
Fibonacci ratios are able to describe the relationship between the trend movement and against the trendy — Recovery of 38.2%, 50% and 61.8% form the primary levels of corrective movements. Use these relations, after a trend in either direction, so that you can predict the degree of fluctuations against the trend. Causing the grid Fibonacci levels on the most pronounced wave up or down, you can see how interest Fibonacci intersect with key trading price levels.
The coincidence of the graph chart patterns and Fibonacci retracement levels can point you to excellent trading signals. You should always analyze the highs, lows as well as moving averages for the final confirmation of the importance of certain Fibonacci level.
Differences between trading Fibonacci retracement levels and the basic graphical model leads to the forex market noise (correction) instead of profit. Should not be traded on the schedule, if his analysis of the contradictions arise. These differences in the analysis ultimately leads to a large number of turns on price charts. Conversely, a strong correlation between trading Fibonacci levels and chart patterns forex trading provides you with a very predictable turns on a fairly narrow price levels.
I propose to consider five ways to help you when working with trading Fibonacci levels. 5 ways to add these to your arsenal of technical instrumentation and try to apply it always in its subsequent analysis in forex trading (CFD, Futures). I’m sure they will serve you well for many years, and earn or save more than one thousand dollars.
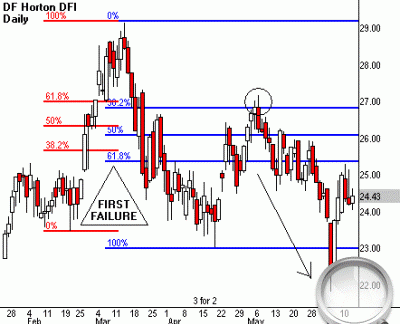
First rise / first failure
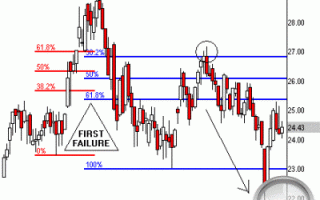
First rise / first failure — this is the first 100% retracement of the previous trend within your time frame. It warns of a turn after a new maximum or minimum. 100% recovery of Fibonacci violating the basic direction of price movement and completes the current trend, which took place consolidation. From this Fibonacci level, the previous trend can be restored, if in doing so he breaks through the old 38% Fibonacci level. Very often, Forex traders will use this level to open a trading position with a small acceptable risk against the previous trend.
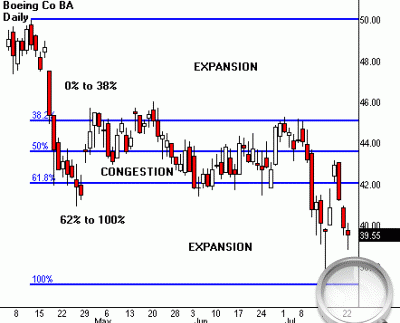
Hunting for a parabola
Parabolic move in the forex market can occur between 0% — 38,2% and 61,8% — 100% trading Fibonacci levels in all the trends in the market. This pattern provides an excellent opportunity to find a big trend in the search of commercial transactions. Always make sure the clusters in the price chart, which are formed on the Fibonacci retracement levels of 38,2% or 61,8%. Then use a simple breakout system, once the price comes out of this area of the cluster. The next surge can be quite dramatic, once the price starts to move like a magnet back to the previous maximum or minimum. Of course, this forex strategy only works if suddenly you can identify these levels in advance.
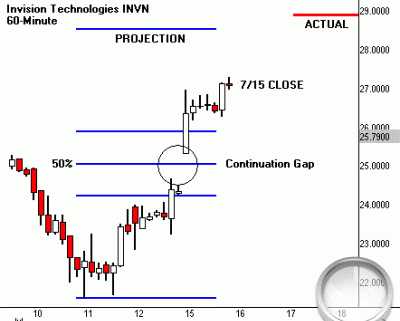
Continuation gap
You often can find the exact price at which the rally is over or fall, using the continuation gap as a tool for expanding Fibonacci levels. Define EFG method of its placement in the dead center of the vertical wavelength for the price. Then start to draw the Fibonacci grid at the beginning of the current trend and continue it so that the gap was at a 50% Fibonacci retracement level. Extension of the Fibonacci grid will show us the final price rally or decline.
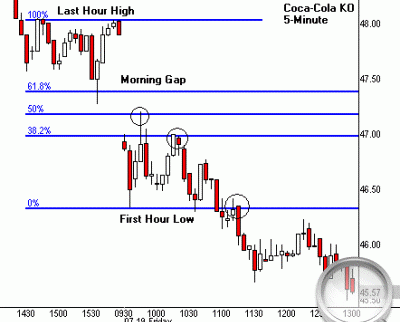
«Night Grid»
Choose a very active marketing tool, and start drawing a grid Fibonacci maximum (or minimum) marked the last trading hour of the session. Then build a grid of Fibonacci in the opposite direction to a minimum (or maximum) of the first trading hour the next morning. This sets the price waves which trader forex market tends to be used to determine intraday spreads and intraday breakouts. «Night Grid also offers a trading strategy on the morning GEPe (at break sessions). GEO will often pass through the key Fibonacci retracement level and provide an opportunity to enter a trading position in the market with little risk of a rollback.
The second maximum / minimum
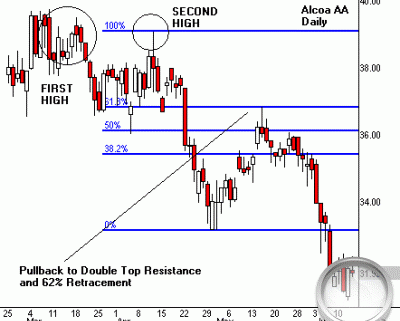
Many Forex traders could not decide where to draw the Fibonacci grid. Here, I offer you the following device, which will help you draw it into a more suitable location. Absolute maximum (the maximum price), or at least wave at the price chart is not always the best point to draw the Fibonacci grid in most of the time intervals. Instead, I suggest you find a small «double bottom» or «double top» within the cluster, which started the current trend. Place one end of the Fibonacci grid on this 2-second maximum (or 2-second minimum) instead of 1. This allows you to select a specific Elliott wave corresponding to this trend, in which you are trying to sell.

