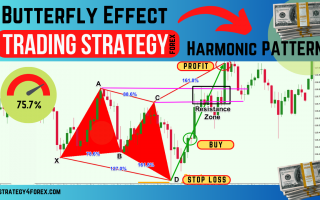
Forex Strategy “Butterfly Effect” – is actually a Harmonic pricing model, which works quite well and the forex market (in any currency pairs and all time frames, although the higher it is, the better), the main difference between the harmonic price patterns from normal patterns (including patterns forex) – a clear model to specific mathematical ratios on Fibonacci among themselves points of this model.
Harmonic price patterns, there are several, but today we look at one of the most common of them – “Butterfly pattern” (to buy – and sell bull-bear).
This strategy, you most likely already met several times on the Internet, but a detailed description of the entrance into the market, as well as still working with this model does not explain nothing. Today, this gap will try to fill me and also explain why, in this model should pay more attention.
Model Gartley “Butterfly” – is a very good model, and usually give a fairly good entry point into the market (something the model can be confused with the flag pattern), but it has its laws, and additional conditions to enter the market.
Previously, we have already considered patterns:
So, let’s consider how to define and enter into the market for forex strategy “Butterfly Effect”:

in the figure above you can see a bullish Gartley model “Butterfly” (ie, the transaction will be concluded on the purchase)
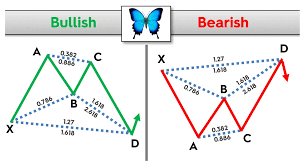
1) red lines highlighted areas of price movement on the chart of any currency pair:
Point X – the starting point, starting point of the harmonic model, “Butterfly”.
XA – impulse price movement up the chart (it was Pulse, rather than lateral movement – that movement which is directed in one direction, and without strong kickbacks – the movement as “one breath”), which we take as a basis and stretch for him Fibonacci (build in the course of price movements from the bottom-up).
AB – correcting the price movement from point X to point A, while point B should be within 50% to 61.8% Fibonacci (desirable but not obligatory, even if the price will stay around this level – also very good, but if the price is still reached 50% Fibonacci and jumped away from him – a good sign).
BC – an upward movement in the model Butterfly (directed in the same direction as the segment XA), while point C must be placed at a distance from 61,8% to 78,6% of Fibonacci, built on the segment from point A to point B.
CD – 2 nd correctional movement of prices down to a segment XA, and it can be in the 1.272 – 1.618 times the segment BC!
The point D – a point the deal to buy (on the model of Gartley “Butterfly”) may be in the range from 61.8% to 0,78,6% Fibonacci.
2) Consequently, we have a vicious cycle of price constructs, and unless some correlation is not the same in this model, the bargain is simply not. And we pay close attention to the last point is the construction of D, and to this point and set aside an order to buy – Buy Limit. More precisely, for a point fits exactly level 61,8% Fibonacci extension of the XA or 1.618% of the sun, can also be a point of contact with the channel, etc. (for details see the deal on the pattern of the flag).
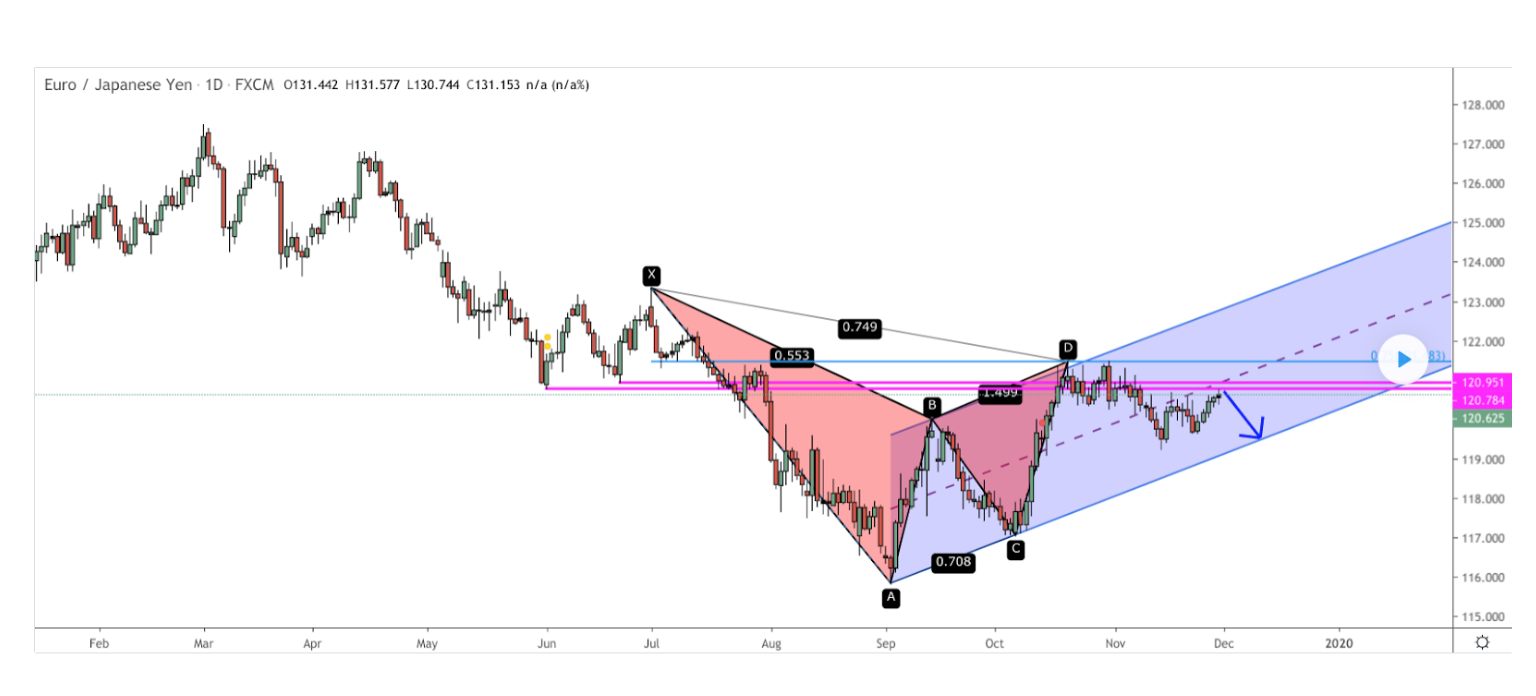
But looks like the classic example of a bullish butterfly on a currency pair USDCAD (M5):

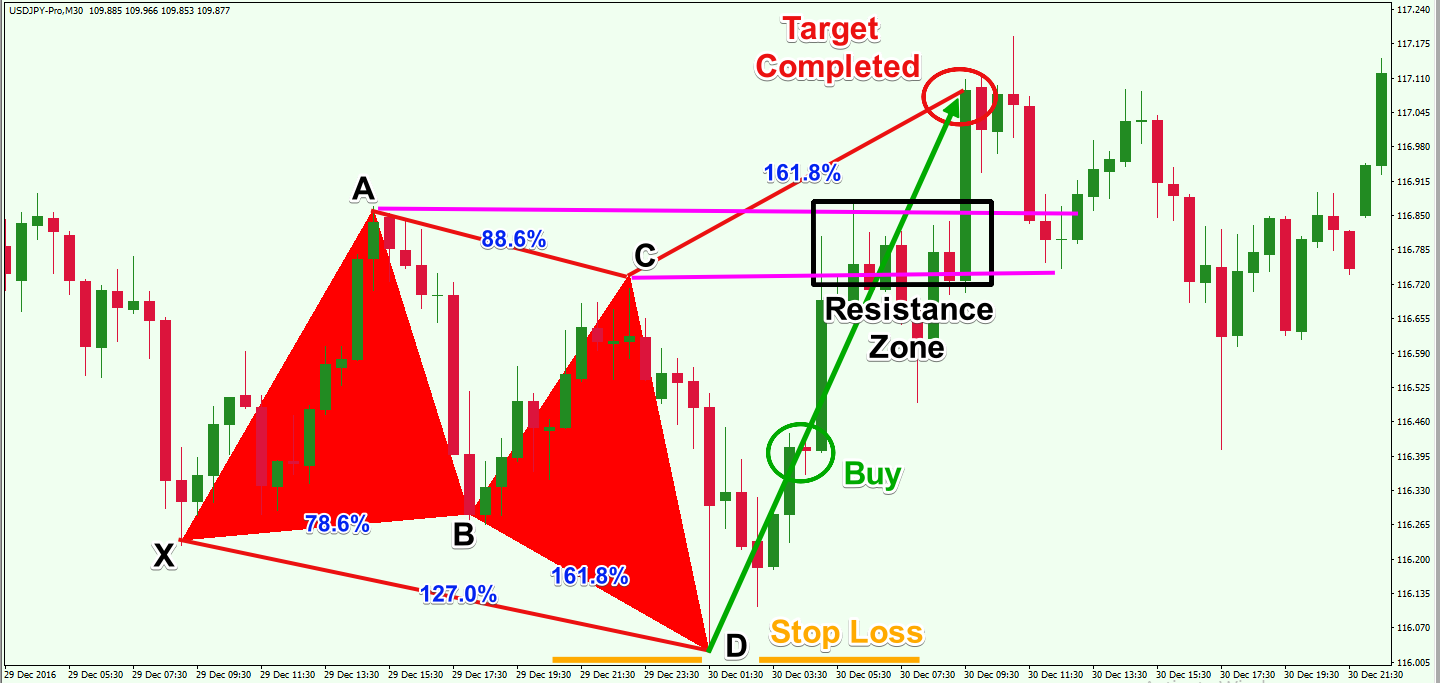
There’s also the 2 nd option to enter the market – a more conservative (but with this entry into the market stop-loss will be a little more than when trading Buy Limit-y, but you definitely will see you enter the market or not – tk . will be formed point D and finally you can check all the Fibonacci ratios, and only then set the order for the breakdown – Buy Stop).
Warrant a buy-stop set on the breakdown of the trend line, constructed from the maxima of the segment CD or enter the market at market price after the close of the candles above the trend line constructed (as in the forex strategy at Trendlines – just do not rebound, and the breakdown).
3) Because we got an entry point into the market, the next step we determine where to place the same stop-loss. A stop-loss, I recommend installing a few points below the level of 78,6% of Fibonacci.
4) Where to place take-profit – it’s you again, you can use the Fibonacci extension to determine exit from the market, set in an open position trailing stop (or relocate the position to breakeven, when you reach a certain count pips) use the important levels to exit a position. But I believe that the first goal for the profit (or part of the profit) – the point A (that it is possible to set take-profit or close the first part of the profits – for example 30% -50% of the open transaction).
For transactions on sale – check the conditions (and correspondingly the reverse pattern of “Butterfly” – bear)!

Example deal to sell the model “Bear Butterfly”, the currency pair USDCHF (H1):

NOTE: The ideal bullish and bearish harmonic model of “Butterfly” appear not so often in the forex market, but if you notice them and they will comply with all terms and conditions – safely open trading position, because the probability of profit is very high ! But at the same time, in any case, we should not forget about the money management Forex!
And another example:
Forex video strategy “Butterfly Effect”:
- I am attaching an indicator that allows you to determine harmonic patterns – ZUP_v64
- Although I personally recommend looking for patterns manually – it’s more reliable that way!