Fibonacci (Fibo – levels) are often used Most of traders in financial markets, including forex.
At Fibonacci levels built a lot of forex strategy
One of the more popular forex trading strategies, the reasons for that price, correct relative to the previous trend, will be measured by the distance equal to the previous motion multiplied by coefficients 0.236 0.382 0.5 0.618.
From my own experience, that each currency pair has its own significant levels of bounces and rotation, which may be used as signals for entry into the market. But all the same levels of 0.382, 0.5 and 0.618 very work more often than other levels … Signal “to the opening position” occurs once, after a long adjustment to the price movement of at least 0.2-0.3 part of the last movement.
The strategy of trade on the Fibonacci levels as follows:
Draw Fibo-levels, and establish an order to buy or sell some of these levels, with a safety stop-loss above the next important Fibo-level.
For example:
if you want to open a position near the level of 0.382, the stop-loss set slightly above the Fibonacci sequence – 0.5;
If some level of 0.5, stop-loss set above the Fibo level of 0.618;
But if you want to take a position about level 0.618 – stop-loss set slightly above the Fibonacci 0.75.

Consider the example shown below:
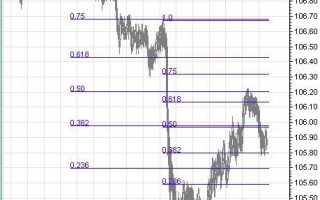
After the fall of the currency pair USDJPY from 107.15 to 105.20 draw Fibo-levels in the course of price movements. And just drew Fibo levels after falling from 106.70 to 105.20.
After the start of the correctional movements in this currency pair, set aside a warrant for the sale of approximately 0.382 Fibo level of corrective movements of the big fall. This Fibonacci level coincides almost exactly with the level of 50% drop is smaller.
Ie put a Sell Limit order on USDJPY at 105.95, Stop-Loss above 0.5 on a larger fall to 106.30 …
Price went up to this level and bounced away, and then went up and the level of 0.382 was broken up. And the next level to stop or reverse the current trend is the realization of approximately 0.5 of a large drop, and also note that this level again almost coincided with a fall of 0.618 of a smaller one. But since we set the stop loss at 106.30, then we are still in the open position. If you are using when trading trailing stop, we could easily rearrange the order is triggered to breakeven and wait for further development of the event, if the price has gone further, trail position and closes at the turn of the lucrative stop-loss or with zero.
So, if you close the past Trailing, then put the next warrant Sell Limit USDJPY 106.15, and the S / L (stop loss) at 106.50. At this time, the level of 50% of the correctional movement was an important level to move down and stand (in this case, the coincidence of 2 levels in one location had the strongest support for the bear – sellers).
If you do not use a trailing stop at the opening of the 1 st position, then our stop-loss at 106.30 anyway broke down and we closed the position at a profit.
Upper red arrow denotes the point of our entry into the market for sale.

This was followed by nearly 2-day correction in the market, after which, according to the laws of the genre, the fall of the currency pair has been continued.
The second arrow denotes the second entry into the market after the correction movement, which ended just about the previous Low.
On the pessimists saying that the history we all can teach anyone, claiming that all of the above happened in the real account …