Today we will consider the next test of the Forex & Crypto strategy “Method of entry M Rivalanda”, based on the signals of candlestick analysis. Currency pair – any, interval – D1. How to trade using the trading system – see the link above, and here we will consider the test results.
Profitability chart of the Rivaland Method for the period: from 1/01/2018 to 5/09/2018 inclusive (9 months):
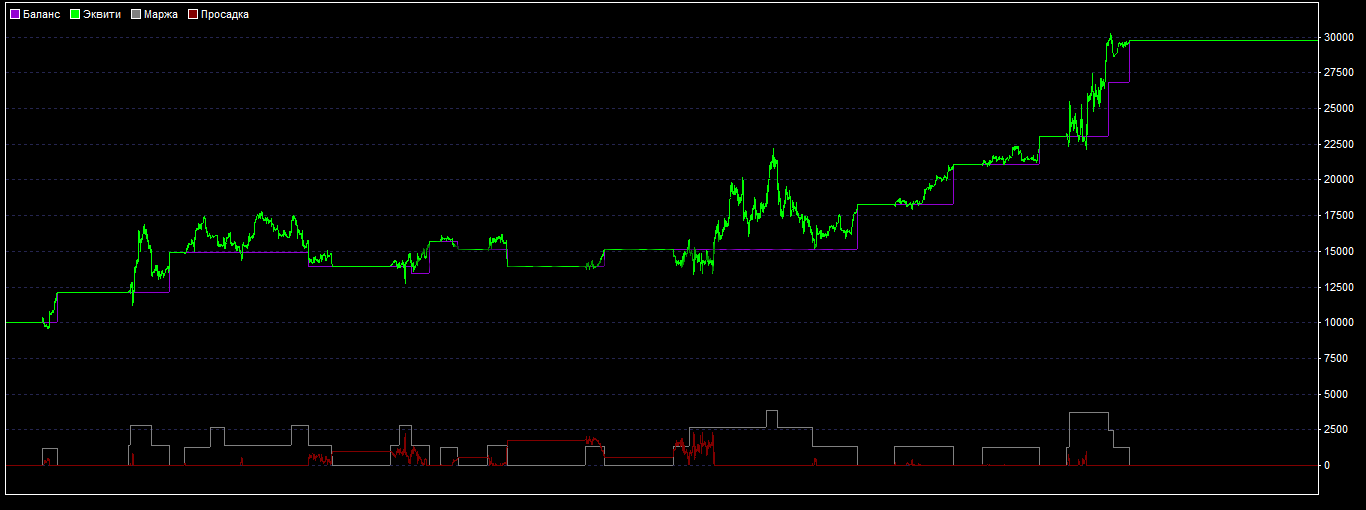
It can be seen from the chart that although the strategy is profitable, there is no evenly ascending chart, therefore drawdowns are possible and although the total profit is also not bad, it is quite possible that you will have to be nervous when trading. And of course, only strict adherence to the conditions will lead to profit (as we see in the final section of the chart).
But also, we should not forget that this method is designed for trading trends, and if it is not on the market, then of course we will not see profit. I quote the description of the strategy: “Its essence is to find an entry point at the moment of completion of the correction in the direction of the main clearly expressed trend.”
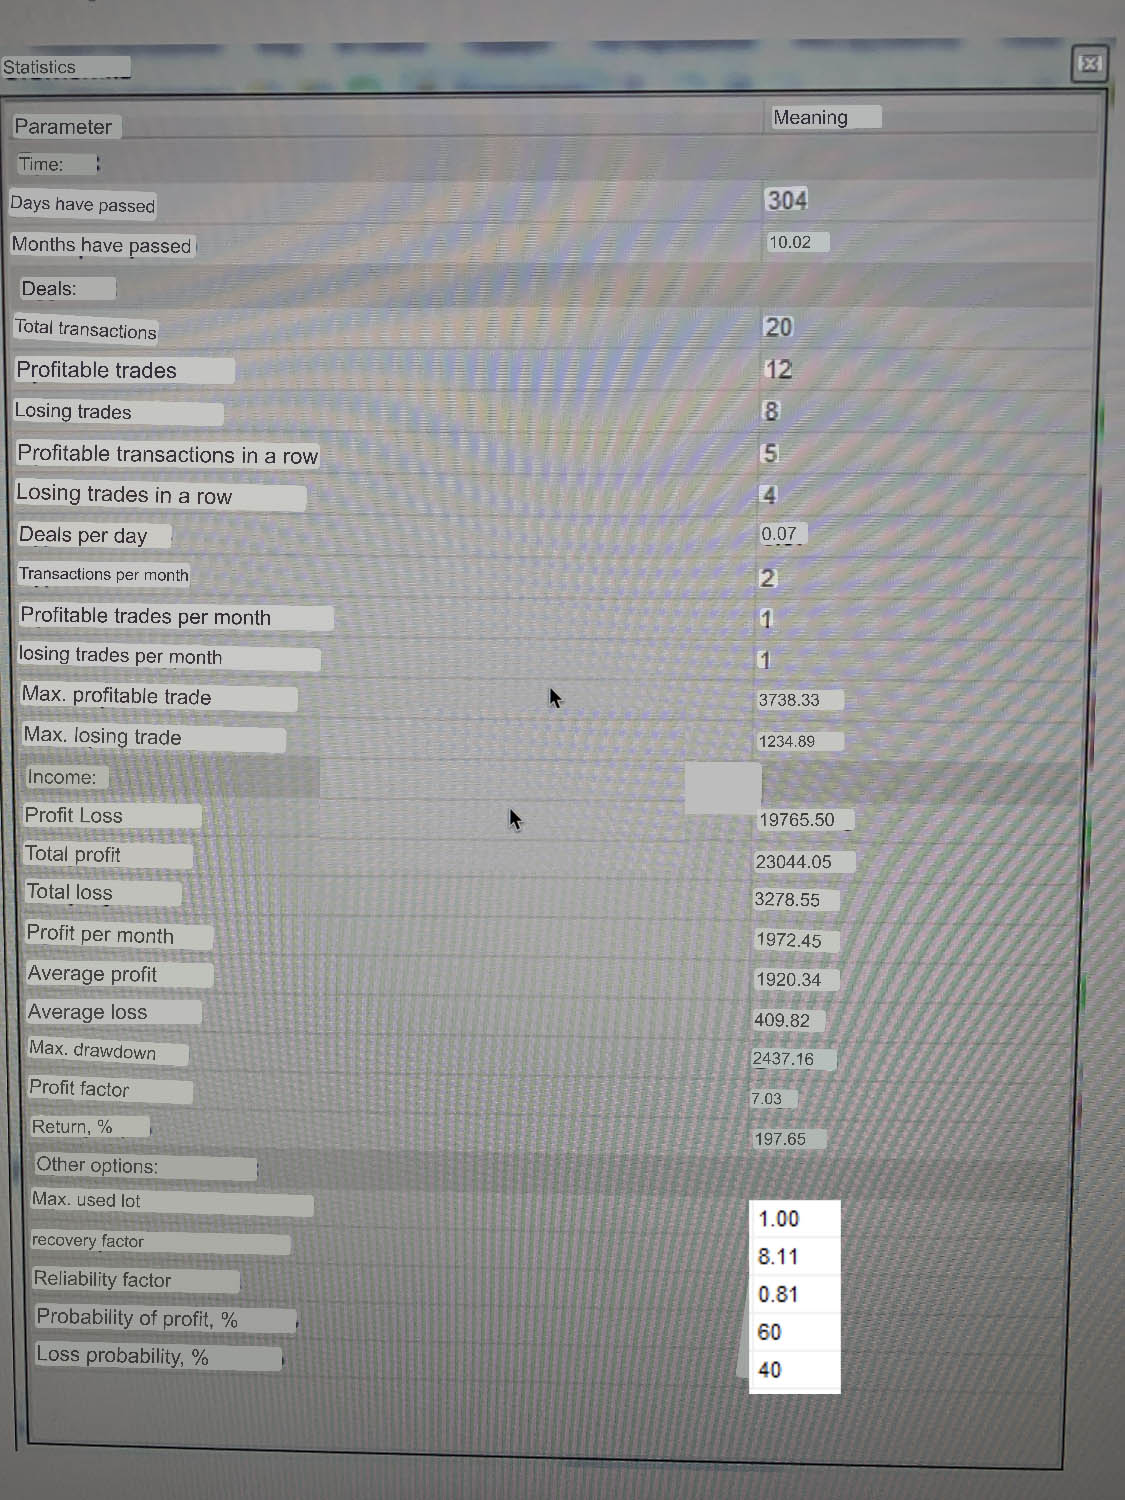
See the table for testing details:
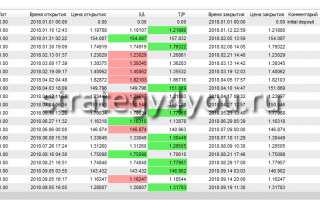
Detailed entry report:
As you can see, not many deals were made during these 9 months: only 20. Of them: Profitable – 12, unprofitable – 8