Butterfly Gartley [Harmonic Pattern] – Forex & Crypto Trading Strategy is actually a Harmonic Price Model that works quite well in the forex market (on any currency pairs and any time frames, although the higher it is, the better); The main difference between harmonic price patterns and conventional patterns (including forex patterns) is a clearly defined model with certain mathematical Fibonacci relationships between the points of this model.
There are several Harmonic Price Patterns, but today we will look at one of the most common of them – the “Butterfly Pattern” (bull for buying and bearish for selling).
Most likely, you have already met this strategy on the Internet more than once, but no one explains a detailed description of how to enter the market, as well as how to work with this model. Today I will try to fill this gap and also explain why, more attention should be paid to this model.
Gartley’s Butterfly model is a very good model and usually gives quite good entry points to the market (somehow this model can be confused with the Flag pattern), but it has its own patterns and additional conditions for entering the market.
And so, let’s look at how to accurately determine and enter the market using the Butterfly Effect forex strategy:
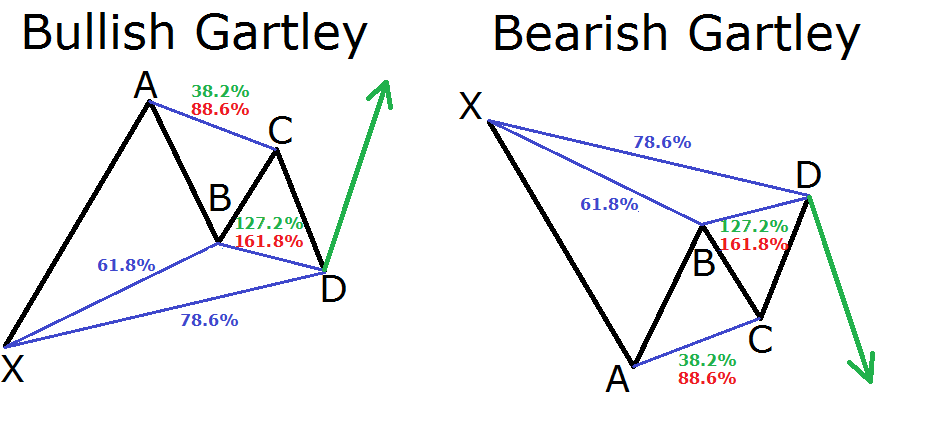
in the picture above, you can observe the Bullish Gartley Butterfly pattern (i.e. the trade will be BUY)
1) The red lines highlight the areas of price movement on the chart of any currency pair:
point X – starting point, reference point of the harmonic model “Butterfly”
XA – impulsive price movement upwards on the chart (precisely IMPULSE, and not lateral movement – i.e. movement that is directed in one direction, and without strong rollbacks – movement as “in one breath”), which we take as a basis and stretch the Fibonacci levels along it (we build in the direction of price movement from bottom to top)
AB – corrective price movement from point X to point A, while point B should be in the range from 50% to 61.8% Fibonacci (desirable, but not a mandatory condition, even if the price is near this level – also very good, but if the price still reached the 50% Fibonacci level and rebounded from it, this is a good sign)
BC – upward movement in the Butterfly pattern (directed in the same direction as the segment XA), while point C should be at a distance from 61.8% to 78.6% Fibonacci, built on the segment from point A to point B
CD – 2nd corrective price movement down for the XA segment, and it can be 1.272 – 1.618 times more than the BC segment!
At the same time, point D – the point of concluding a Buy transaction (according to the Gartley Butterfly model) can be in the range from 61.8% to 0.78.6% Fibonacci.
2) Consequently, we have a closed cycle of price constructions, and if some ratio does not match in this model, then a trade transaction simply does not conclude. And we pay close attention to the construction of the last point D and to this point and put a pending order to buy – Buy Limit. More precisely, the level of 61.8% Fibonacci from XA or the extension of 1.618% from BC is suitable for the point, there may also be a point of contact with the channel, etc.
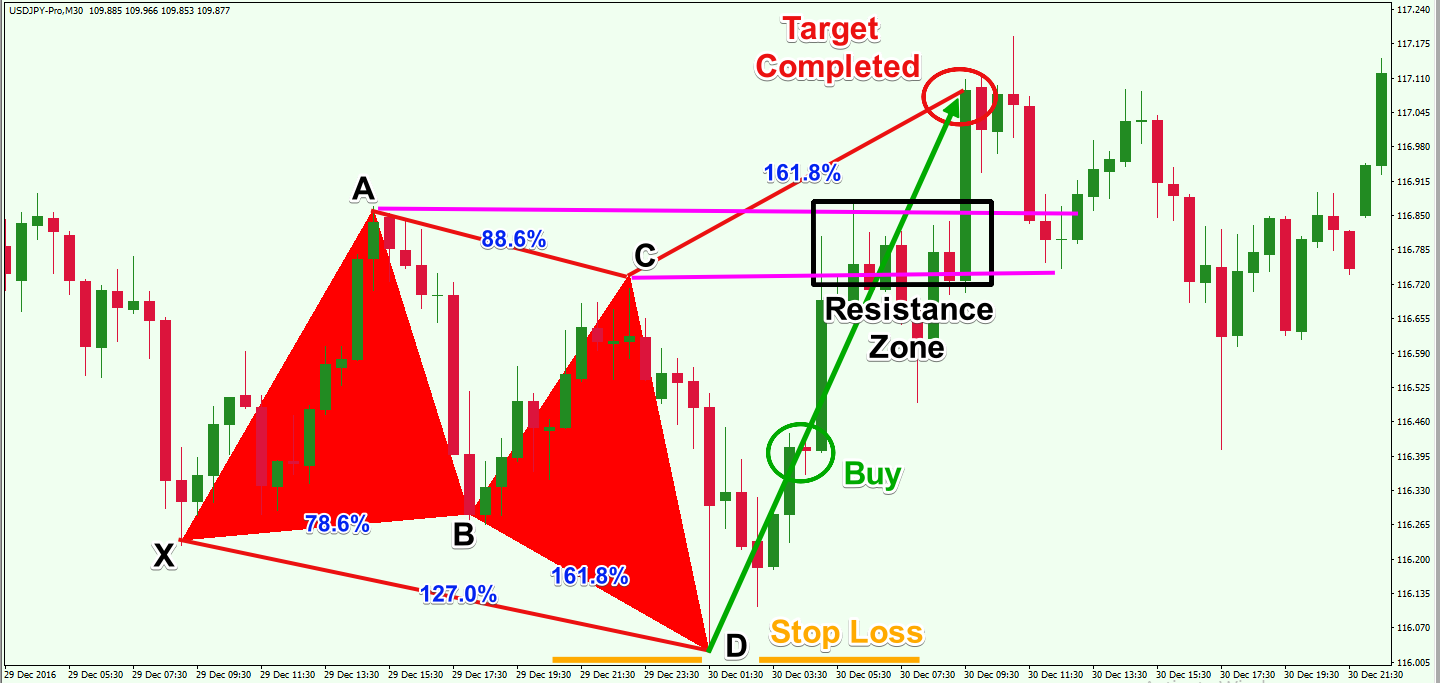
And here is an example of a classic Bullish Butterfly on the USDJPY (M30) currency pair:
There is also a 2nd option for entering the market – more conservative
But with such an entry into the market, the stop loss will be a little higher than when trading with Buy Limit, but then you will definitely see if you enter the market or not – because. point D will be finally formed and you will be able to check all the Fibonacci ratios and only after that place an order for a breakdown – Buy Stop.
We place a buy-stop order on a breakdown of a trend line built on the highs of the CD segment or enter the market at the market price after the candle closes above the constructed trend line (as in the Forex strategy on Trend Lines – only not for a rebound, but for a breakdown)
3) Because we got the entry point into the market, then the next step is to determine where to put the stop loss. And I recommend setting a stop loss a few points below the 78.6% Fibonacci level itself.
4) Where to set a take profit – it’s up to you, again, you can use Fibonacci extensions to determine the exit points from the market, set a trailing stop on an open position (or rearrange the position to breakeven when you reach a certain number of profit points), use important levels to exit a trading position. But how do I think that the first goal for fixing profits (or part of profits) is point A (this is where you can put a take profit or close the first part of the profit – for example, 30% -50% of an open transaction).
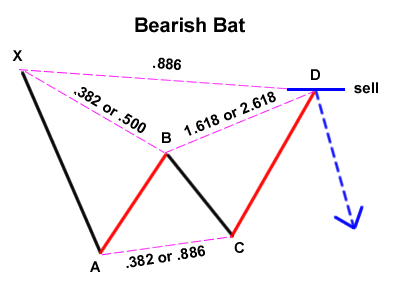
For transactions to sell – reverse conditions (and, accordingly, the reverse pattern “Butterfly” – bearish)!
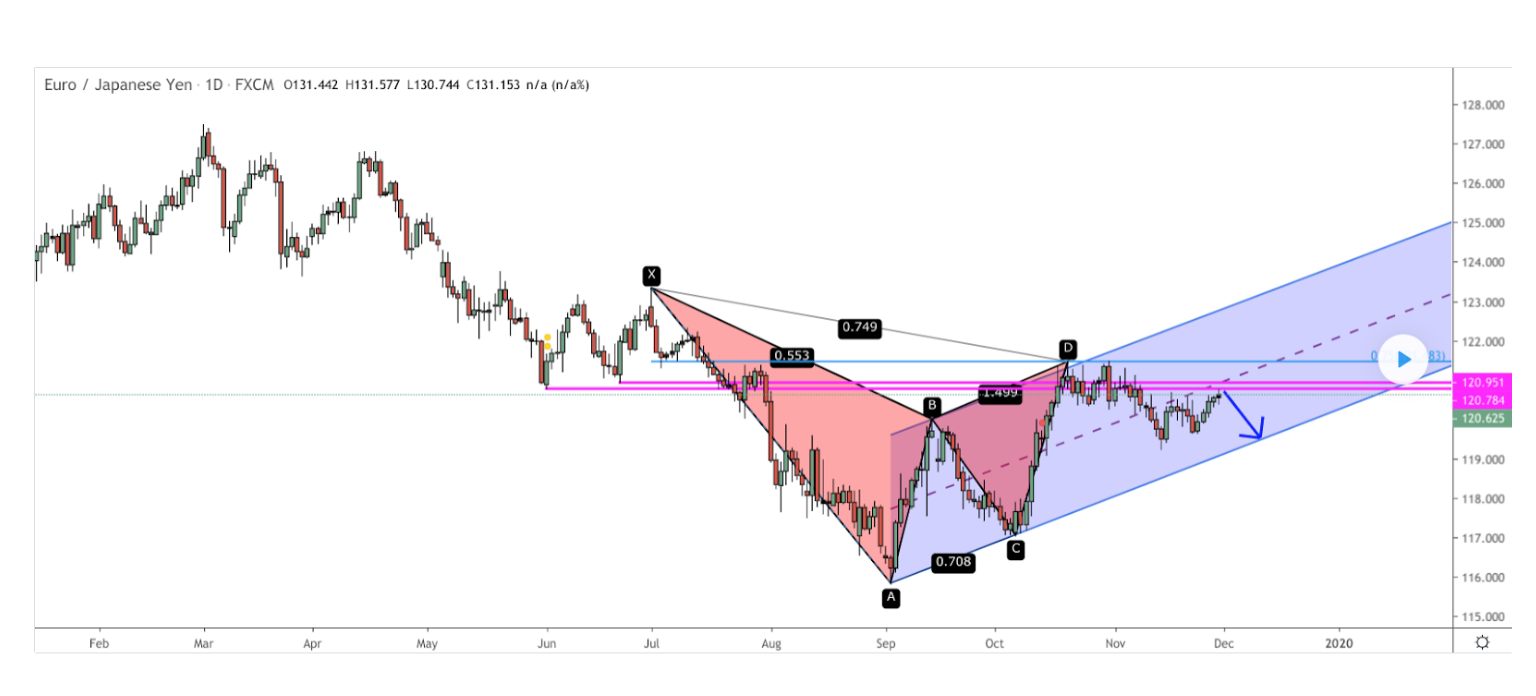
An example of a Sell trade using the “Bear Butterfly” model, EURJPY (H1) currency pair:
NOTE: Ideal bullish and bearish Butterfly harmonic patterns do not appear so often in the forex market, but if you notice them and they meet all the conditions for making a deal, feel free to open a trading position, because. the probability of making a profit is very high!
Forex indicators and Metatrader 4 templates are not used in this forex strategy, that’s why I don’t post them.
I also recommend watching the video version of the Butterfly Effect forex strategy, in which I will tell you how to accurately identify using the examples of the Butterfly model and point out the main mistakes in their identification!
![Butterfly Gartley [Harmonic Pattern] – Forex & Crypto Trading Strategy](https://strategy4forex.com/wp-content/cache/thumb/02/552e0b9fa601c02_320x200.png)