The graphical pattern or the Dead Cat Jump Pattern [Forex & Crypto Trading Strategy], like many other price patterns, originates from the securities market, and the model only develops downwards, and even taking into account the fact that the foreign exchange market differs from the securities market in a relative understanding of the direction of the trend, this pattern and here, ideally, is much more often formed precisely on a downward movement.
Many will find similarities in this pattern with other patterns, patterns and entry methods, but in most cases it is the “dead cat jump” chart pattern that underlies them, and not vice versa.
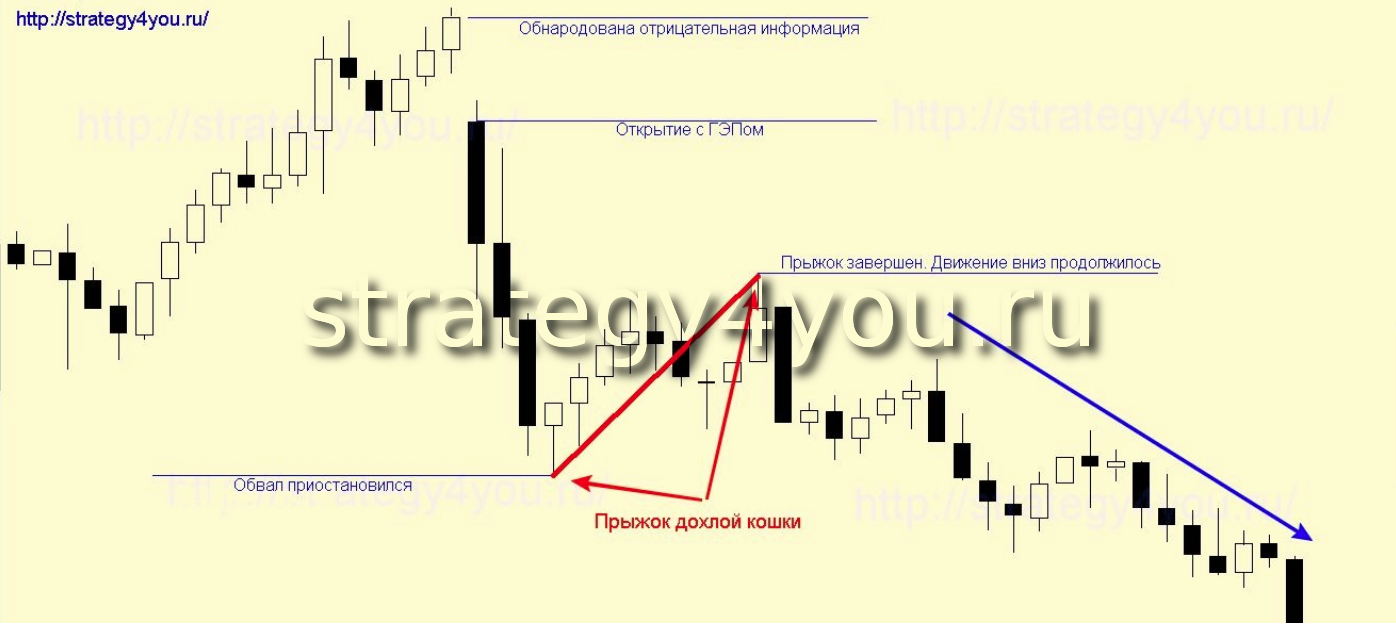
For a complete understanding, let’s go a little deeper into the essence of what is happening inside the model during formation on the RZB. At some point (often during a closed market), very negative information appears on the asset and a queue of those wishing to get rid of the loss-making security as soon as possible is lined up for sale. As a result, there is a sharp downward impulsive move at the open (often with a gap). After a relatively short decline (about 3-5 days), the price bounces up and begins to gradually recover (this is the jump). Having won back part of the losses (ideally no more than 45% – 50%), the price reverses and, having rewritten the low, continues to decline.
As you can see, this saying very accurately characterizes this model.
Now let’s organize the received information.
Stages of pattern formation:
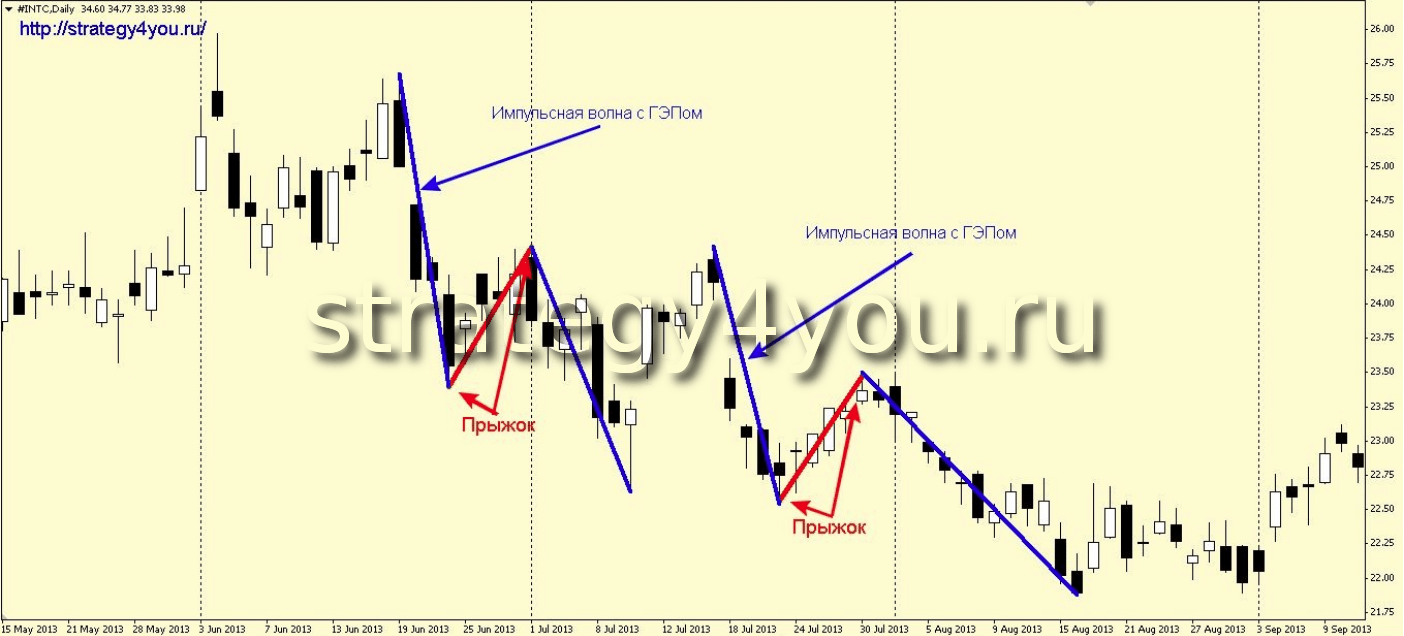
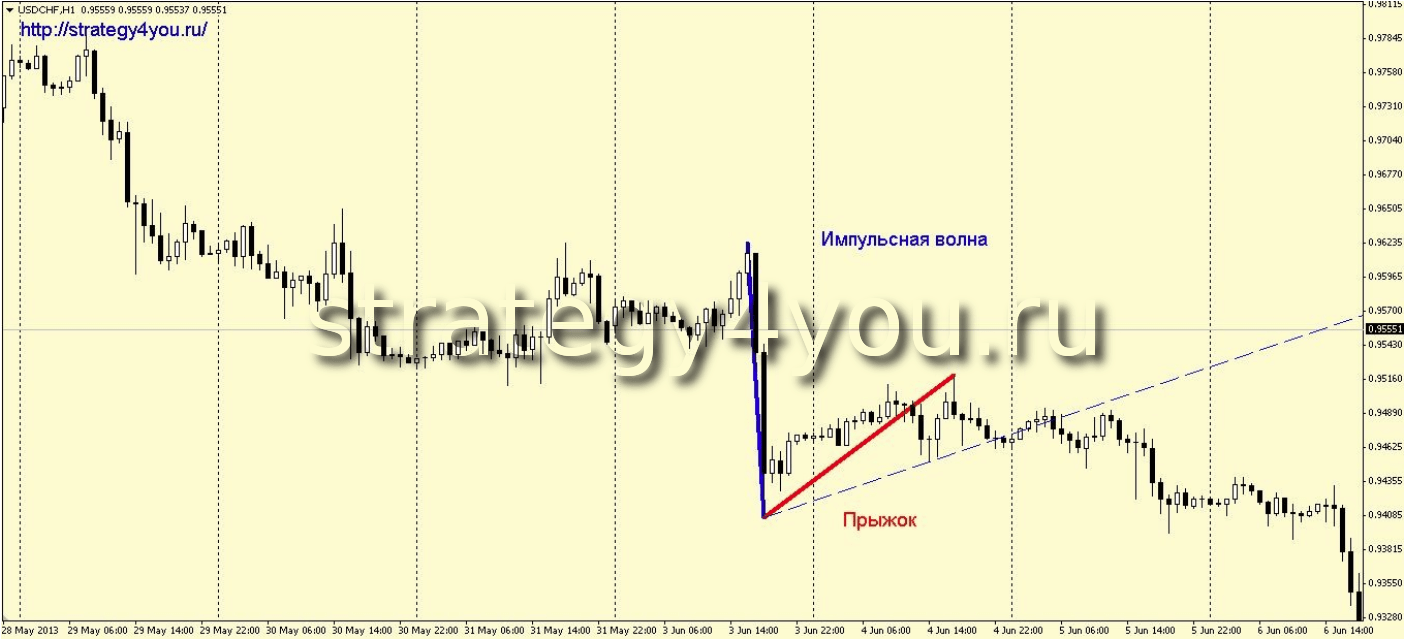
1) A sharp (impulsive) downward movement. This movement is often unpredictable and quite significant. It is desirable to have a gap in the initial stage of the breakthrough. All subsequent candles close below the low of the previous candle.
2) A low is formed, and the price rolls back inside the impulse wave. This correction, ideally, does not exceed the fibonacci level of 50 stretched along the impulse wave. It is this wave that is called the dead cat jump.
3) After the completion of the correction, the downward movement continues, but more measured and smoother.
In this model, you can work in both directions: buy at the beginning of the jump and sell at its end. It is clear that the first option to perform correctly and accurately is technically quite difficult and requires great skill and experience. Entering the second option is already easier, that is, this is a standard entry at the end of the correction, and the following options are offered here:
– on the breakdown of the trend line built on the lows of the entire jump.
– on the census of the minimum of the impulse wave.
– you can also use this model in graphical analysis, as an additional very strong signal.
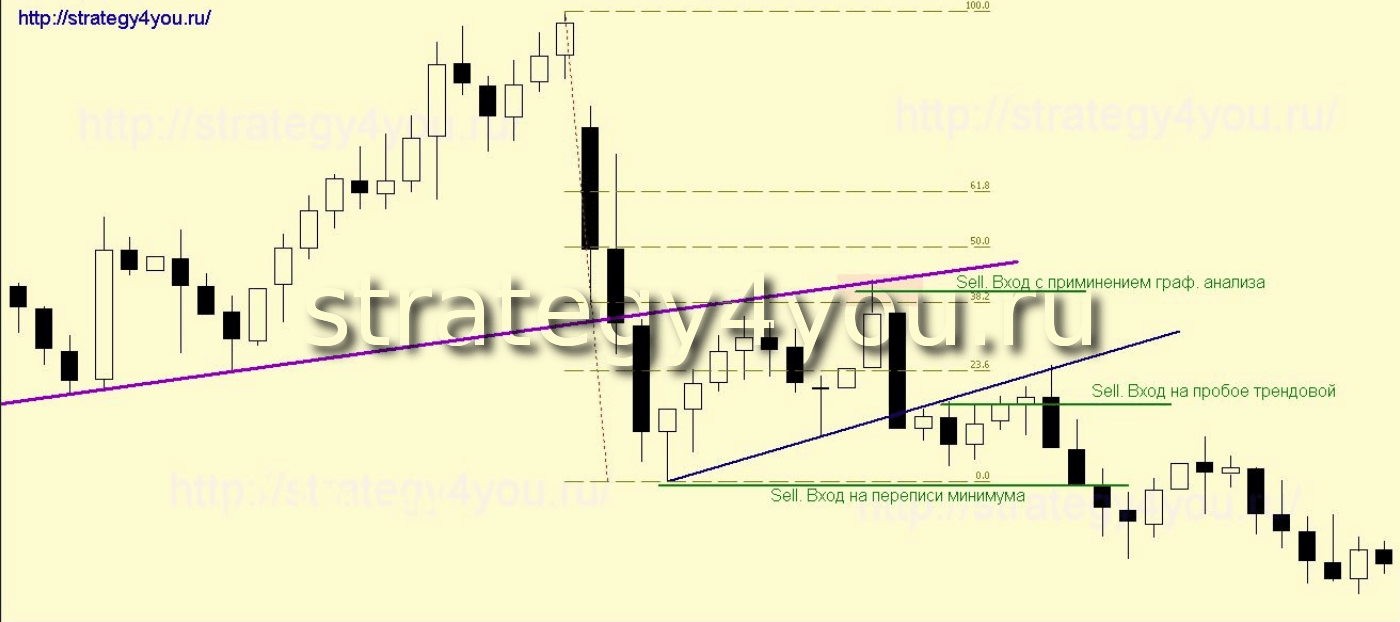
To set a safety stop (stop-loss), you can use the fibonacci levels from the impulse wave, and according to the second entry option, the stop is placed behind the maximum jump.
Profit fixation can be done in several ways:
— at the breakdown of the trend line, at the highs of the last downward movement, starting from the high of the jump.
– on the extensions of the fibonacci stretched throughout the jump.
— use of other graphic signals.
Add-ons for the Dead Cat Jump pattern:
— Models formed on an already existing downtrend work out more often and the last downward wave goes further than models formed on an uptrend.
— If you use volumes, then you should be aware that during the impulse wave there is a significant increase in volumes.
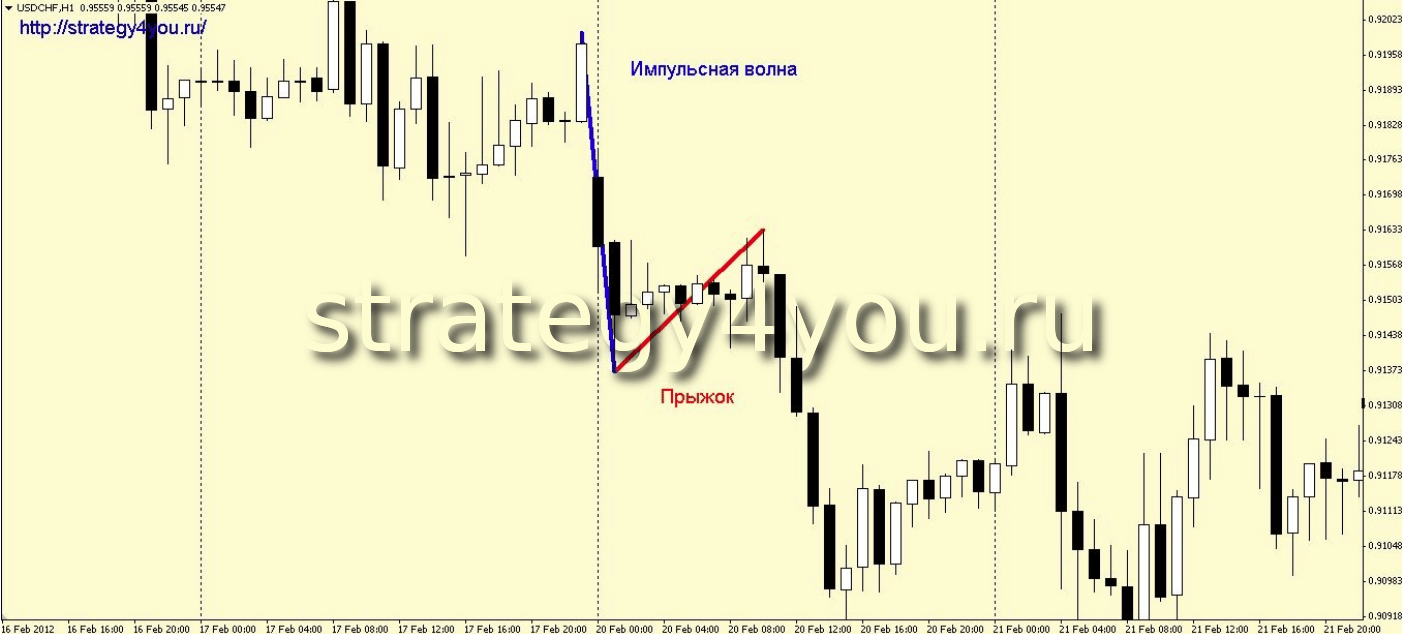
— The foreign exchange market has its own characteristics, since it is round-the-clock and gaps are quite rare. For this reason, sharp (news) movements are also suitable, within which a gap is noticed on smaller timeframes or just slippage.
– the jump usually lasts from 5 to 25 days (candles).
– the longest stage is the last wave, which can last from 10 to 50 days.
– Beware of patterns that gapped at the end of an impulse wave, as most failures of this pattern occurred if the price managed to close the gap. Only a quarter of such cases continued to decline.
– the longer the pulse wave length, the greater the jump.
– the minimum of the impulse wave at the appearance of a jump of a dead cat is rewritten in 75 cases out of a hundred.
– in the foreign exchange market, the model is more common in cross-rates.
A few real examples of working out a graphical model:
Example 1:
Example 2:
Example 3:

Example 4:

![Dead Cat Jump Pattern [Forex & Crypto Trading Strategy]](https://strategy4forex.com/wp-content/cache/thumb/67/725fa9aa914f567_320x200.png)