Today we will consider the LAST BREATH Pattern [Forex & Crypto Trading Strategy], which will allow you to determine the moment of the end of the trend (at least temporarily) and make a deal on a signal in the direction of a reversal:
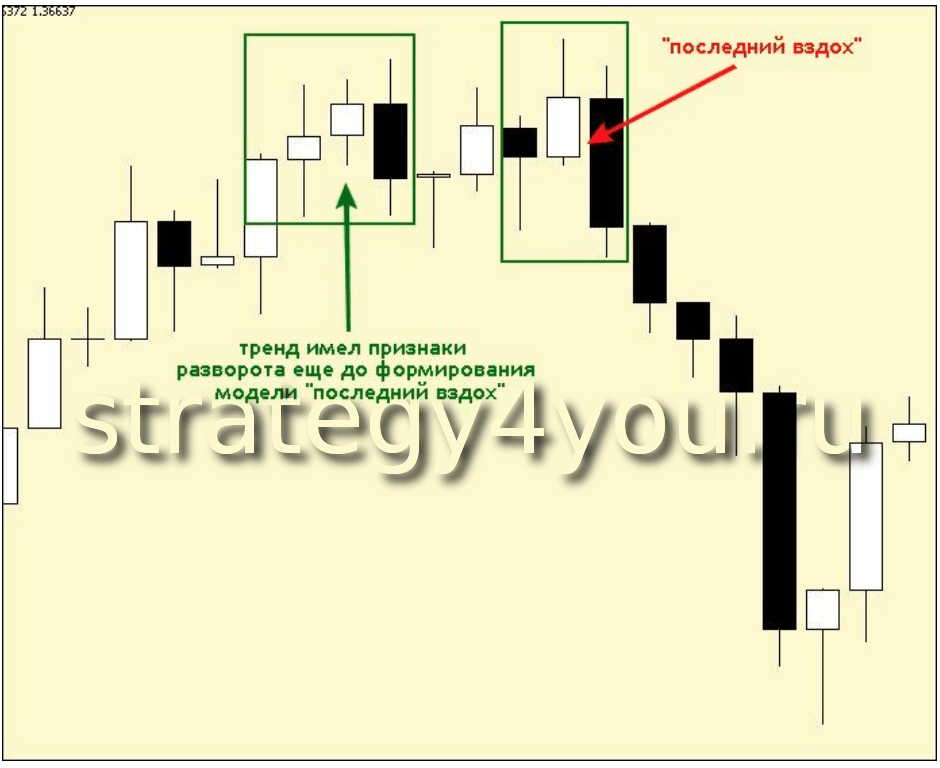
As you know, the trend very often ends with a sharp impulse movement along the trend with the achievement of new extreme values, which is often called the “last gasp” of the trend or exhaustion. It is on this feature that the “last breath” reversal pattern is based.
This model is not seen so often on the price chart, but if it is detected in time, it becomes possible to enter the market at the earliest stages of the emergence of a new trend.
Initially, this pattern was used only on daily charts, but it is worth saying that it occurs on all time intervals and even works well, although the original version (daily interval) is still more preferable.
The described model has similar features with various models and reversal patterns, such as: “absorption”, “two-day reversal”, “hit day” and similar models. However, the “last breath” model and its trading technique have some additions that qualitatively distinguish it from all of the above.
Description of the reversal pattern:
The pattern can be of 2 types – for sale and for purchase, we will consider each of them.
Bullish Last Breath Pattern:
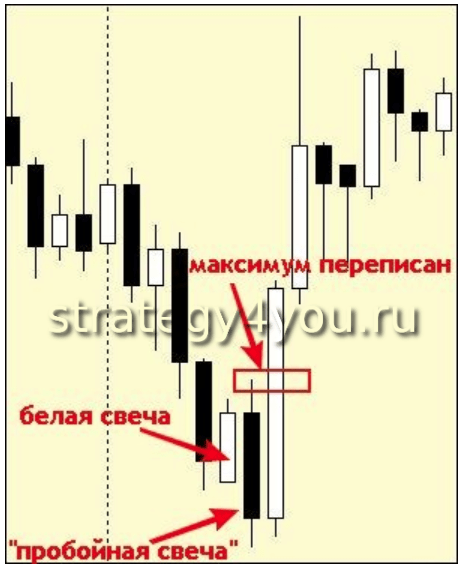
On the downward movement, a white candle is formed (corrective candle in relation to the downtrend), and then immediately one (rarely two and this is not ideal) black candles reach new price lows.
It is the behavior of the price relative to this candle that we will observe, we will call it a breakout candle.
If the next candle cannot rewrite the low of the breakout candle and at the same time rewrite its high, then the model can be considered finally formed and the trend is likely to change to an upward one, or at least a protracted deep correction will begin.
Bearish Last Breath Pattern:
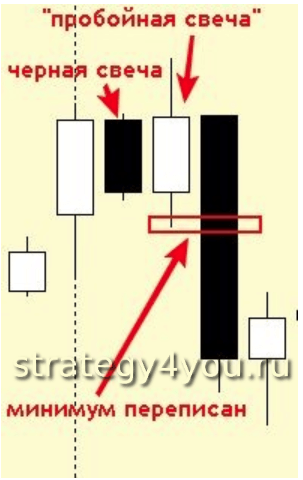
On an upward movement, a candlestick with a black body forms (a corrective candlestick in relation to the uptrend), and then immediately one (rarely two and this is not ideal) white candlesticks reach new price highs.
It is the behavior of the price relative to this candle that we will observe, we will call it a breakout candle.
If the next candle cannot rewrite the high of the breakout candle and at the same time rewrite its low, then the model can be considered finally formed and the trend is likely to change to a downtrend or, at least, a protracted deep correction will begin.
Trading strategy based on the Last Breath model
BUY entry:
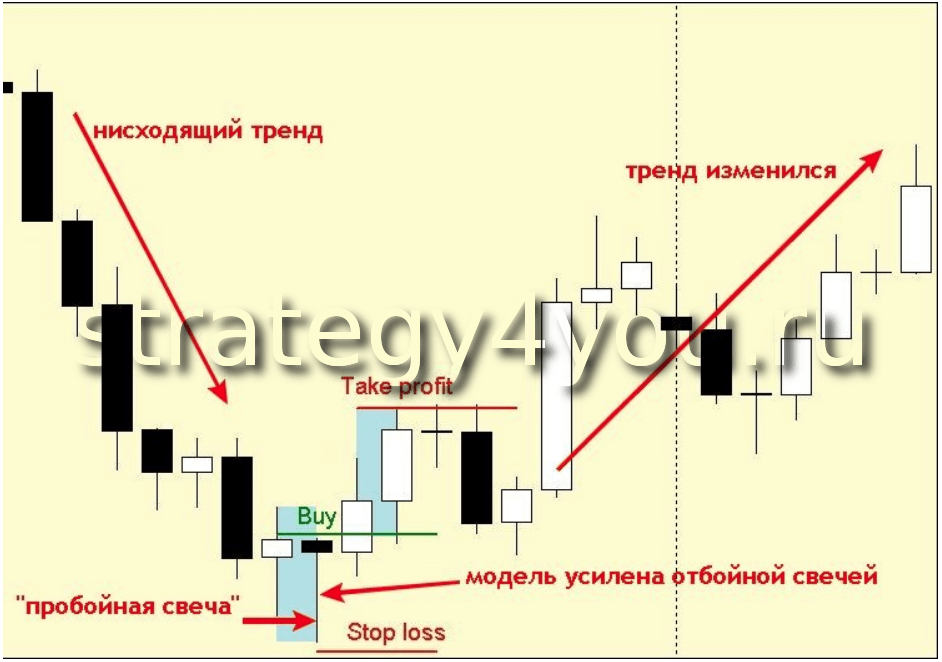
1) On the price chart, with a downward movement, a bullish “last breath” pattern is formed.
2) Set a breakout order to buy (buy stop) above the high of the breakout candle.
3) Set the stop loss below the minimum of the breakout candle.
4) Exit with a profit is carried out as follows:
We measure the distance from the maximum of the last correction (this can be either the maximum of the last white candle or the maximum of the breakout candle) and set the take profit at the same distance from the entry point.
It is also possible to fix only a part of the deal at this target level, and close the rest of the deal when signs of a reversal appear. The second option is quite justified, since very often, after reaching the target level, the movement continues along a new trend.
5) The rewriting of the maximum of the breakout candle should take place within no more than two subsequent candles after the formation of the breakout candle, while its minimum should not be rewritten in any way. Otherwise, the buy stop order should be removed.
SELL entry:

1) On the price chart, during an upward movement, a bearish “last breath” pattern is formed.
2) Place a breakout sell order (sell stop) above the low of the breakout candle.
3) Set the stop loss under the high of the breakout candle.
4) Exit with a profit is carried out as follows:
We measure the distance from the minimum of the last correction (it can be at least the last black candle, or the minimum of the breakout candle) and set the take profit at the same distance from the entry point.
It is also possible to fix only a part of the deal at this target level, and close the rest of the deal when signs of a reversal appear. The second option is quite justified, since very often, after reaching the target level, the movement continues along a new trend.
5) The census of the minimum of the breakout candle should take place within no more than two subsequent candles after the formation of the breakout candle, while its maximum should not be rewritten in any way. Otherwise, the buy stop order should be removed.
Additions:
1) The higher the volatility during the formation of the entire “last breath” pattern, the more likely it is to work out.
2) The formation of a “breakout candle” in the form of a doji or similar reversal candles has a very positive effect on this model.
Conclusion:
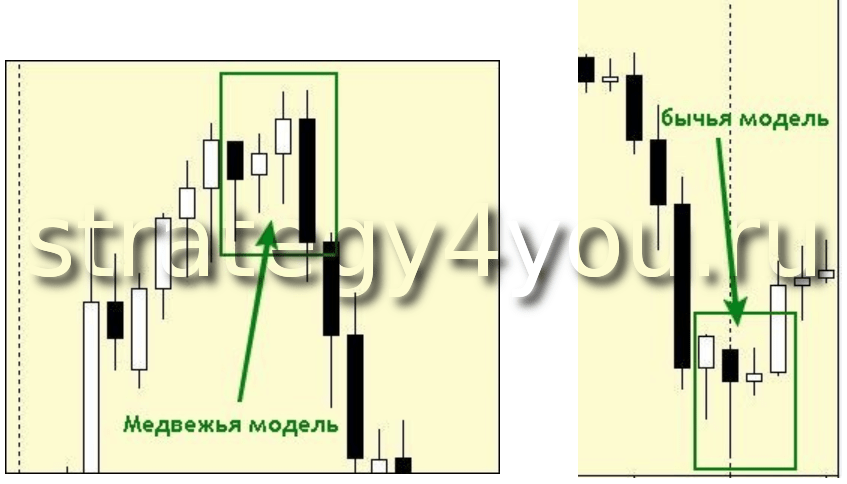
All of the above refers to a perfectly formed model, but, as you know, the market does not always act according to an ideal scenario. Models with small deviations also work out well, but only you can make decisions about entering the market based on them …
Below are some examples of such models with deviations from ideality.

![LAST BREATH Pattern [Forex & Crypto Trading Strategy]](https://strategy4forex.com/wp-content/cache/thumb/62/8e27bfac9062662_320x200.png)