In order to smooth out price fluctuations and identify trends in their movement, the concept of a moving average is used. The term comes from the English moving average.
Despite the fact that the MA indicator gives the impression of a primitive tool, it is basic for trading strategies and the basis for other means of determining the direction of the trend.
Which average to choose and how to use
The trader determines which of the moving averages will help make the right decision based on the situation. None of them can guarantee the success of the solution of the set financial task. It remains the need to connect a filter to suppress false signals.
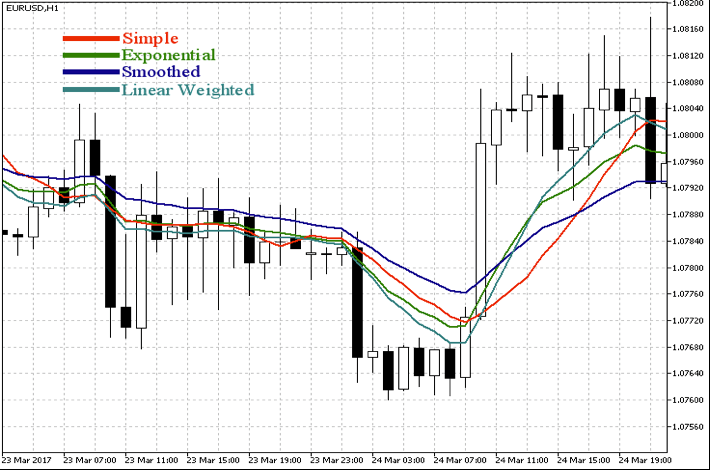
Types – moving MA method (simple, weighted, exponential, etc.)
There are the following types.
SMA indicator (simple moving average) is a simple average, the formula of which is based on the calculation of the arithmetic average. To get the desired value, the price indicators for the specified period are added up. The amount is divided by their number.
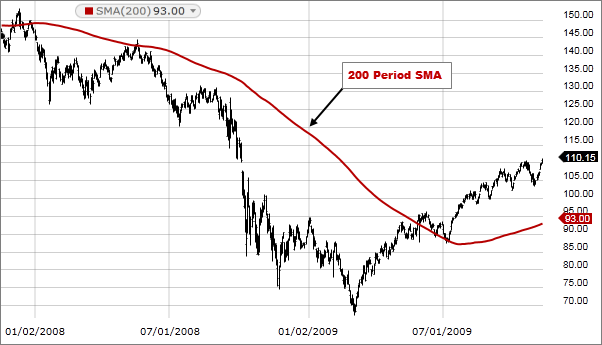
One of the disadvantages of SMA is lag. Therefore, it is not possible to use these calculations in order to take action in a timely manner. Prices in the chain are given equal weight, which makes it difficult to get an accurate picture. The advantage of this type of ma indicator is low sensitivity and a small number of false signals.
In order to have an objective idea of the market dynamics, a weighted moving average was developed. With its help, it was possible to give significance to later prices and reduce the influence of early ones.
In English this type is called Weighted moving average. The principle is that the prices for the interval set by the trader are added up, and the last value of the value is given a larger share, and the early price is given a smaller one. The resulting number is divided by the sum of the values.
If 5 values were taken as the basis, then the formula will look like this: (5P1+4P2+3P3+2P4+1P5)/(5+4+3+ 2+1), where P denotes the price, the figure before the letter is the specific gravity, the number after P is the ordinal number of the cost from the end to the beginning of the period.
This variation is not without flaws:- signal delay, although less than in a simple moving average;
- the number of false signals is higher than when simple averages are used because this version is more sensitive.
Calculation algorithm leading to less price smoothing and greater flexibility – exponential moving average. The formula by which the program calculates the MA indicator takes into account the previous EMA, while giving more weight to the latest candles.
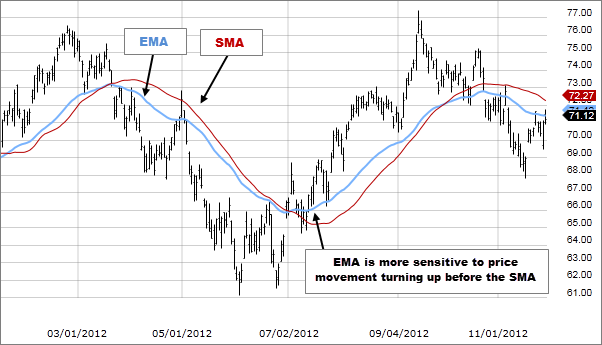
The downside is that less smoothing results in more noise. On the other hand, the EMA shows the trader profitable moments to enter the market, although it does not guarantee an accurate result for large changes in price.
A small number of false signals and low sensitivity distinguish the smoothed indicator ma (Smoothed). The formula for its calculation is more complicated than 3 other types. It is used for strong fluctuations of candles and is not effective for short-term trends.
What is the MA indicator – like a trend line
In order to determine where the trend is moving, use the indicator simple or exponential. The line pointing up and the price above it indicate an up-trend. The price chart passing under the descending moving average indicates a down-trend.
The application of this method of market analysis allows you to see the current state of affairs, but not to predict the movement.
To determine the momentum
Momentum is the rate of change in price fluctuations. To determine it, you need 3 averages, indicators will have different periods.
If the moving averages are moving in parallel, rushing up, we can talk about the rapid growth of the trend. In the case when they intersect, we are talking about strong fluctuations of the candles.
Like a support line
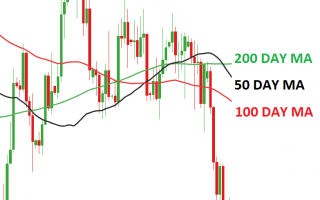
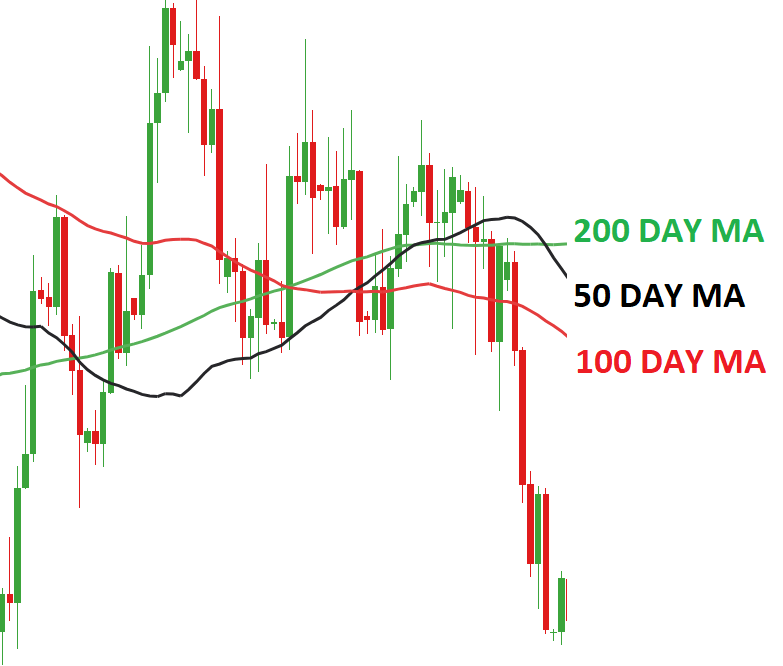
MA allows to predict price supports. To do this, it is assigned round values (50, 100, 200). In the place where the moving average indicator passes, in some cases the price decrease slows down. When using additional technical determinants, it is possible to achieve a rebound from key MAs with periods of 50, 200 days.
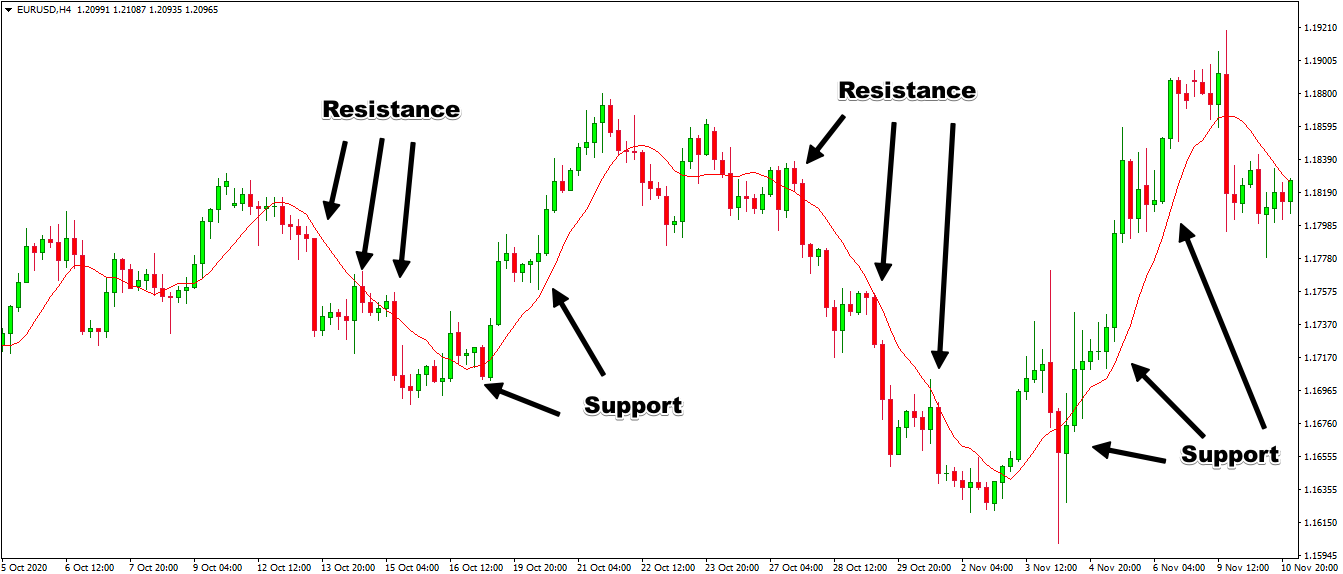
Like a line of resistance
In order to fix profits and determine entry points to short positions, it is considered effective to use the moving average as resistance. To do this, track the zone formed by the price in order not to miss the sequence of candles and patterns for the rebound.
As an indicator of lateral movement
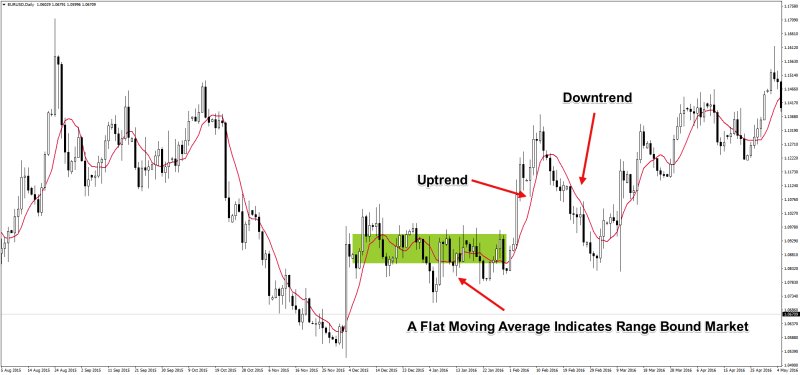
There are many factors that influence profit making. No chart can predict with certainty which will prevail: a bullish or a bearish trend. However, the statement that the analysis of the intersection of moving averages is not useful, and such a chart of averages only confuses, is not true. It is possible to determine what impact such a situation will have on the dynamics of the trend development. As long as the lines intersect, being next to each other, there will be no development. The divergence of the charts indicates the beginning of price dynamics.
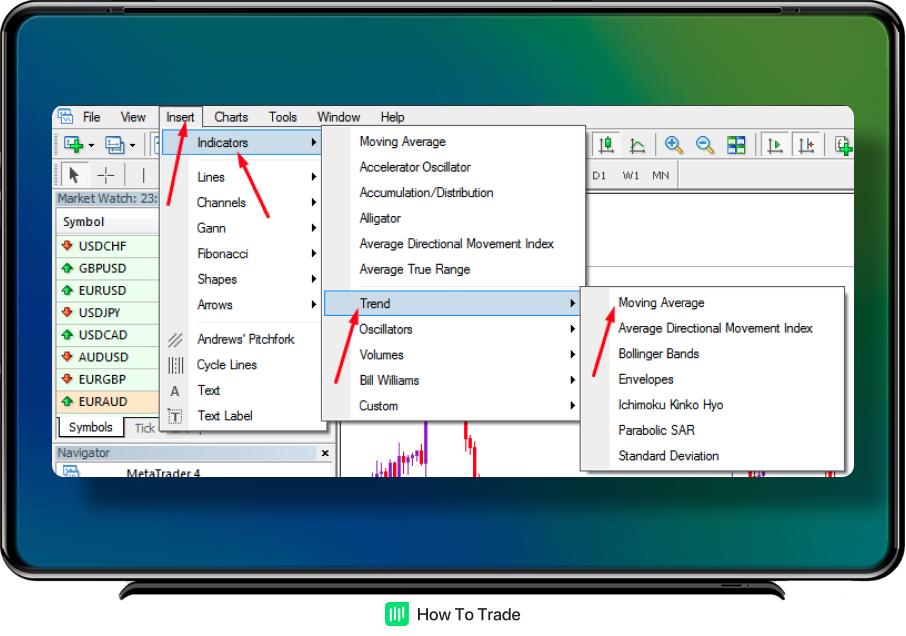
Setting in the MT4 terminal (smoothing, method – construction algorithm)
MT4 (MetaTrader4) – a terminal that offers users a choice of not only moving average indicators, but also other services.
You need to open the settings window in the Insert/Indicators/Trend/Moving Averages tab. The system will prompt you to select the period and type of the curve. It is possible to shift the curve to the right of the price chart by the number of candles set by the client.
The price type is also selected.
There are several options for this:basic values: open price (Open), close price (Close), highest price (High) and lowest price (Low);
arithmetic averages: Median Price (from 2 extreme values), Typical Price (High, Low and closing price), Weighted Close (calculated from 4 options).
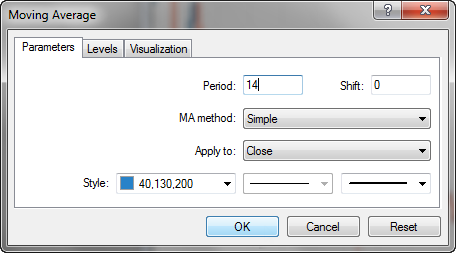
The style (color, thickness, etc.) is chosen at the discretion of the user.
Chart intervals (which one to choose: daily, hourly, minute)
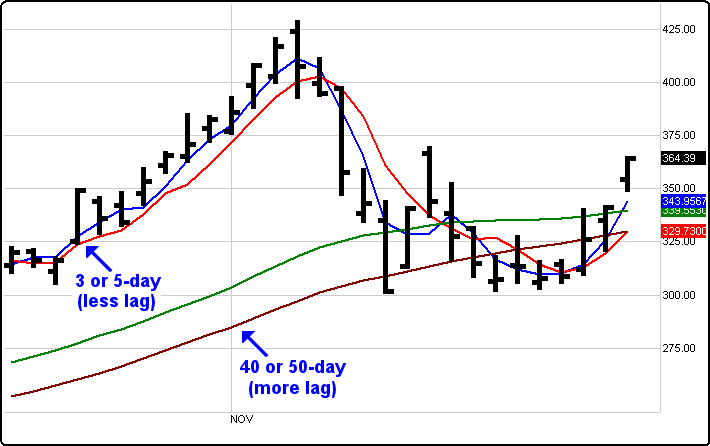
When choosing a period, keep in mind that the longer it is, the less sensitive the moving averages will be. On the other hand, the set parameters will have a greater influence than the time period. Therefore, it is advised to stick to the default settings from the program developer.

Calculation of the time interval (timeframe) is also based on how detailed the moving average picture should be.
If TF is M5 (5 minutes) or M15, period 21 is considered effective. In this case, the reaction to a change in candles will be fast. In a strong trend, resistance and support lines will work.
For the average time frame (H1, i.e. hourly), a value of 50 is selected. For daily and weekly (D1 and W1), a period of 100 is recommended. 200 and 250 are suitable for time frames starting from D1. This indicator works as a moving chart filter, removing too fast candle changes in the market.
Moving speed – how to apply (example)
To assess the true state of things, more than 1 average chart is used – this indicator gives signals late. Therefore, sometimes support lines, resistance lines, etc. are connected as a tool confirming signals.
A speed less than 20 increases the speed of response to candle changes. However, this leads to many false signals.
If you apply the moving chart method at a higher speed, series smoothing will occur. In this case, there are few opportunities for entry.
For example, a trader builds short-term and long-term curves and waits for a signal when a cross occurs. However, without the use of other confirming tools, there is no guarantee that the system will respond in time, and not after the price changes.
Average Trading Strategies
In order to create custom strategies, you need to familiarize yourself with the basic types. Based on them, you can build a large number of options and choose the most effective ones for trading with moving averages.
Based on direction of travel
This MA is distinguished by its simplicity and clarity: by smoothing the fluctuations of the candles, it shows the direction of movement. It is necessary to pay attention to the position of the price chart. If it is above the line pointing up, this indicates the prevalence of the bull market. The reverse situation (price curve below the descending MA) indicates a bearish market.
The statement about moving averages, according to which you need to open a trend at the moment the curve reverses, is not true. It is difficult to predict in which direction the line will turn. You can identify such trends after a price change has occurred. This does not rule out cases where traders take such risks.
It should be taken into account that even when hitting a reversal, there is no guarantee that the MA chart will not turn in the opposite direction after the ascent.
An example is the “AKA” strategy:
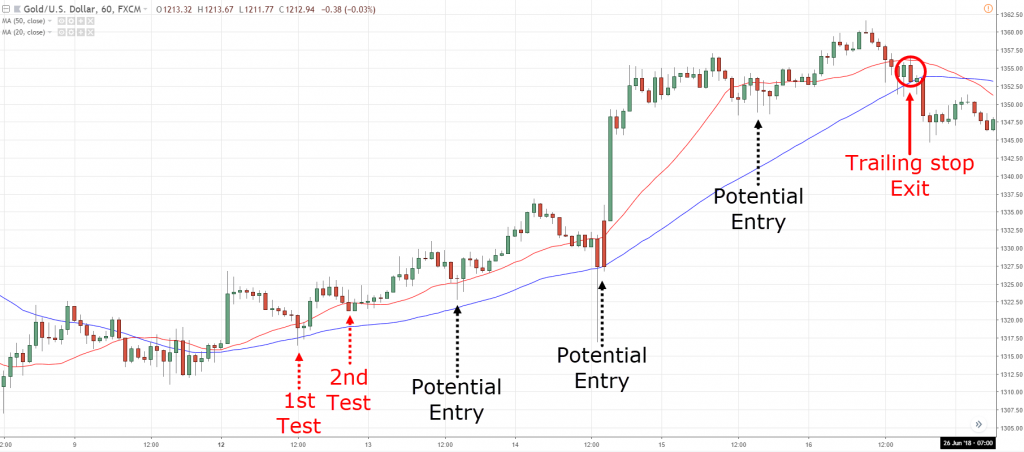
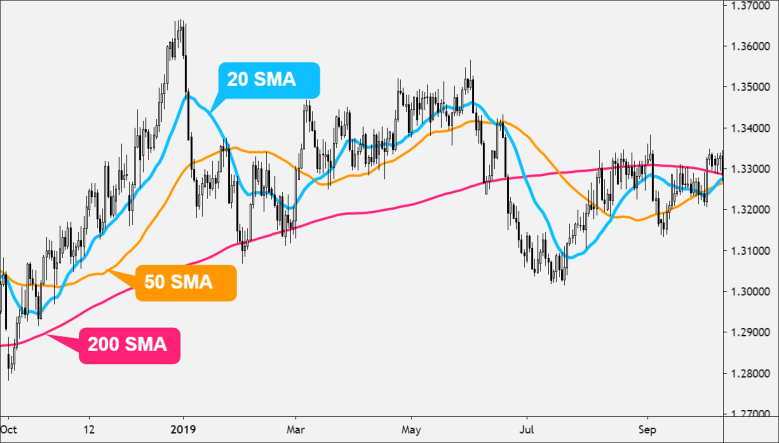
Based on the intersection of the means
This strategy appears to be simple, however, inexperienced users should remember that in order to determine the opening of a trend, it is necessary not only to identify the crossovers of moving averages. The resulting picture may indicate lateral movements.
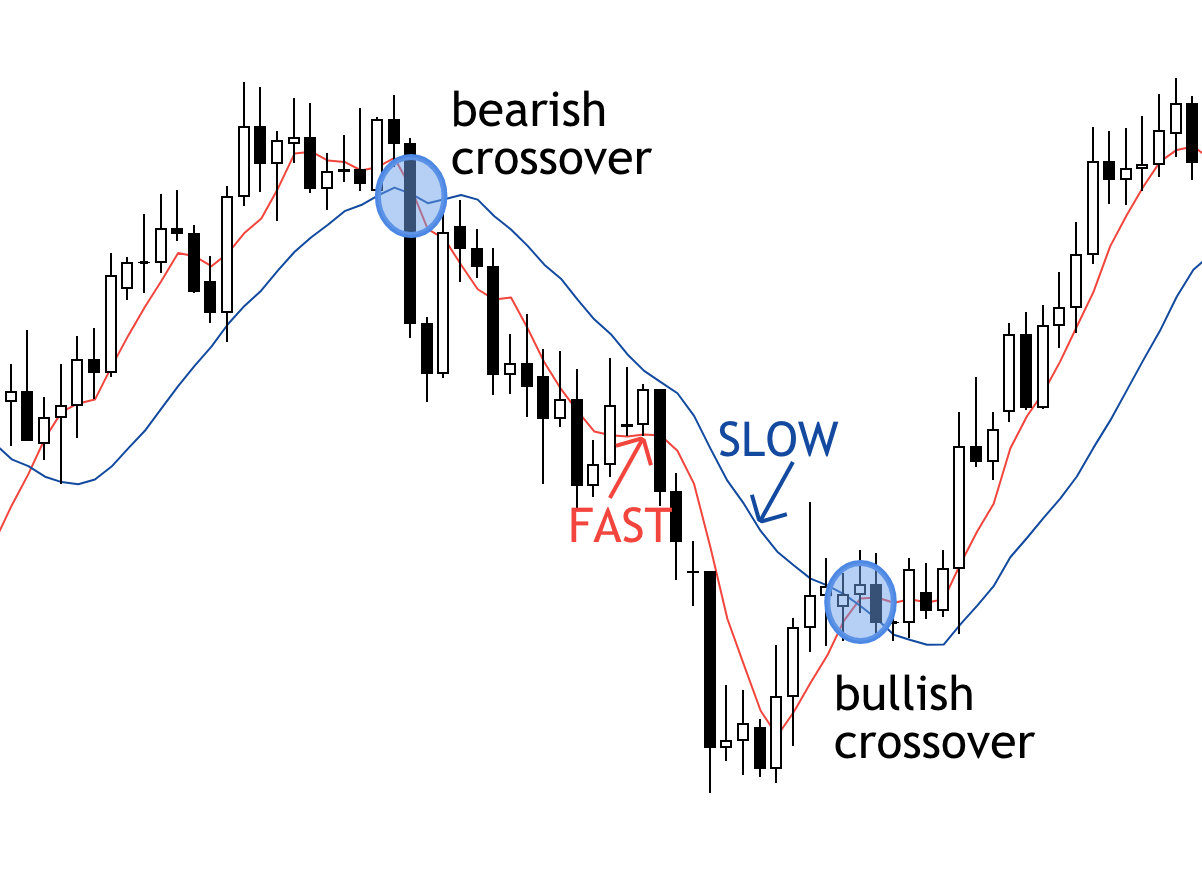
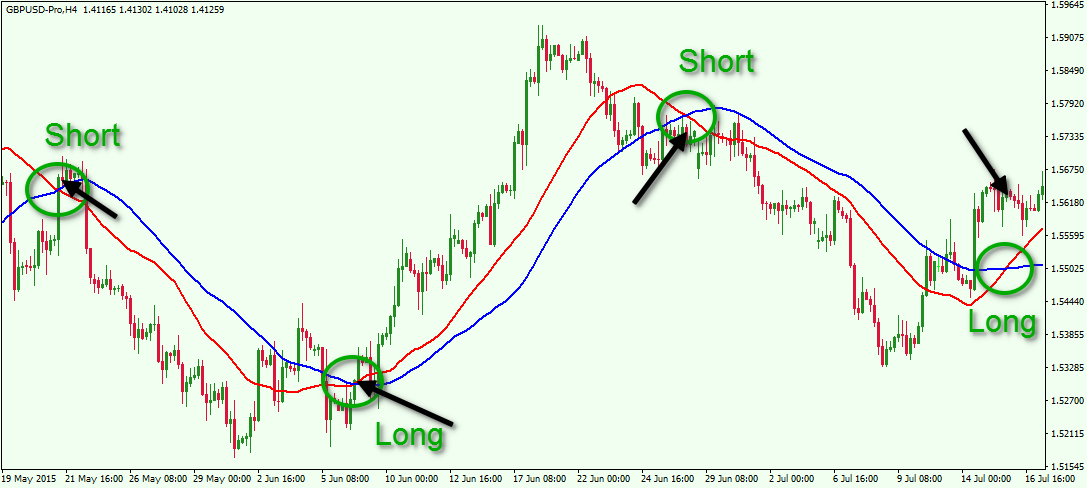
The method is based on the difference in the rates of MA reactions with short and long periods. Since they have different degrees of sensitivity, this leads to their intersection.
buy signal occurs when the faster curve passes through the slower curve from bottom to top;
if the crossover is from top to bottom, it tells sell entry point.
Lines directed in one direction confirm the forecast of the movement of candles.
An example is the “Alligator and Fractals” strategy:
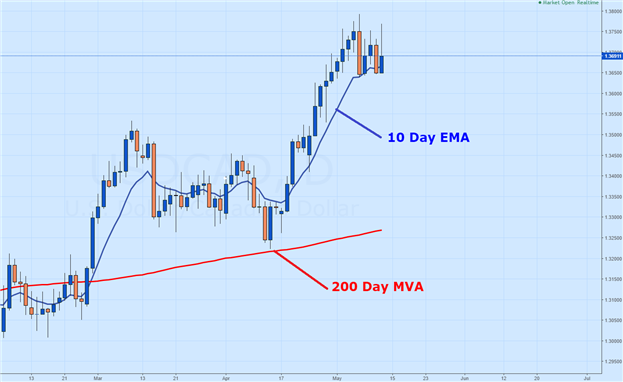
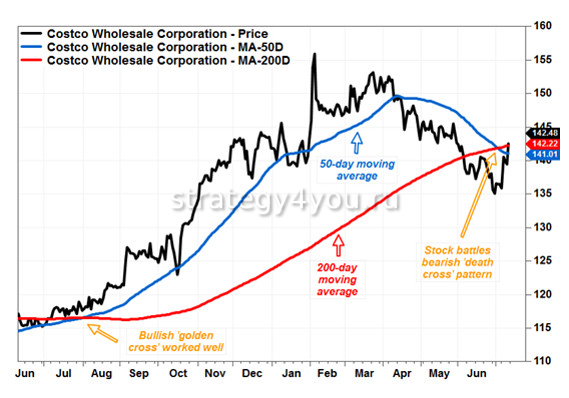
Another of the most popular is the Golden Cross strategy: MA with a period of 50 and 200. Buy and sell signals are called golden cross and death cross.
Many traders are not limited to 2 curves, but build charts from 10 or more MAs. When analyzing long-term trends, a sequence from 50 to 200 is used, adding 10 units to the previous value of the line.
Based on the average price crossover
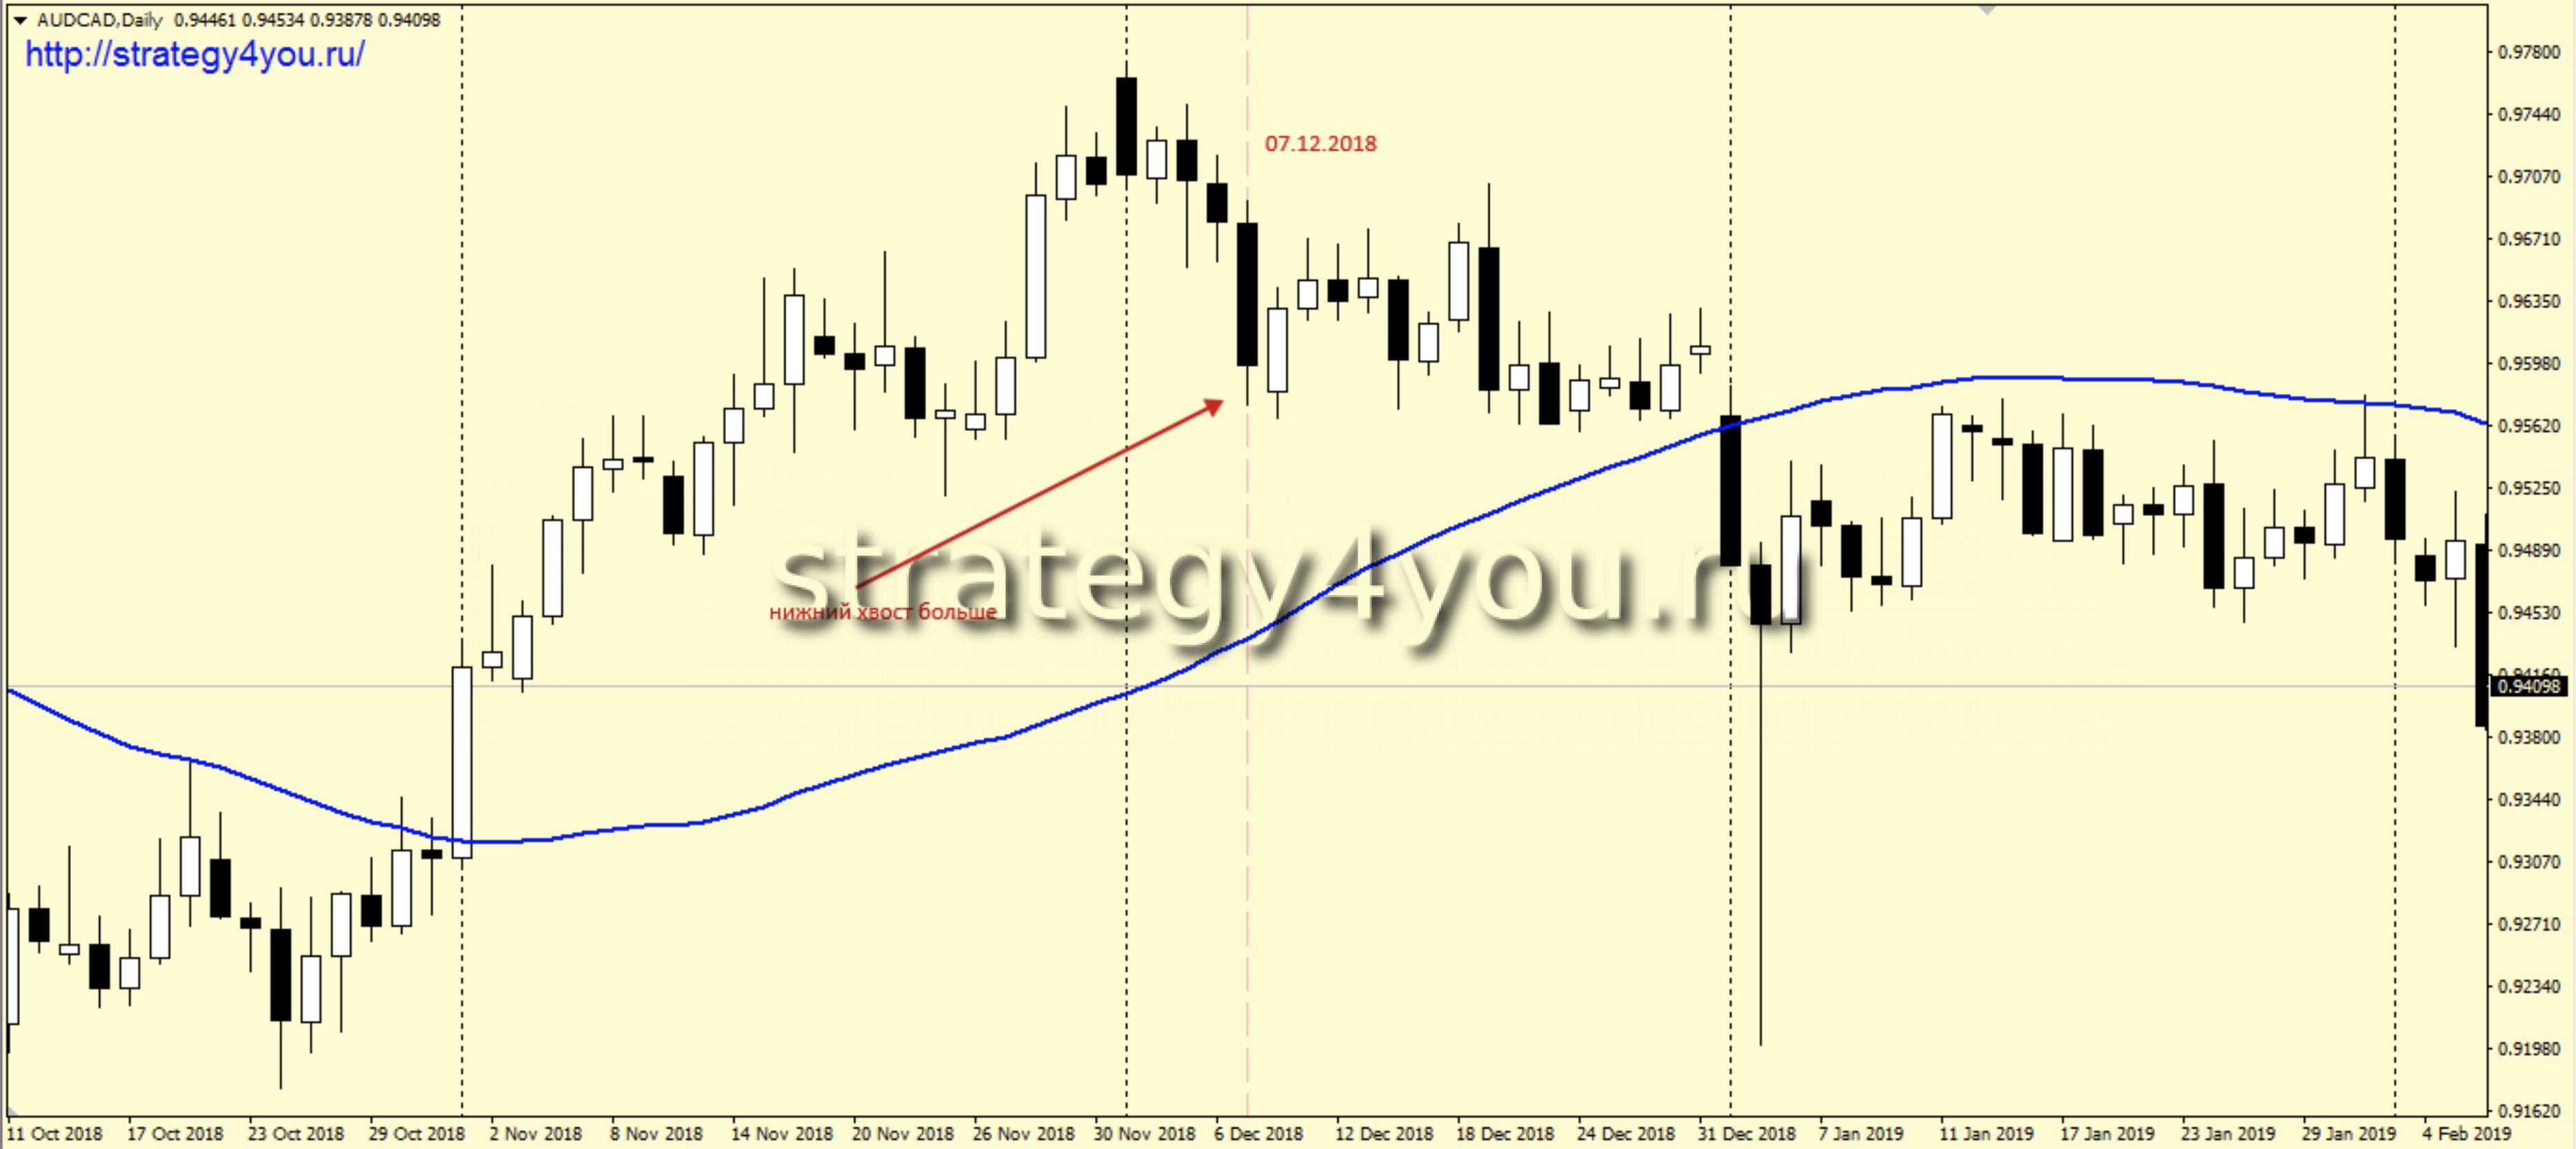
According to statistics, tracking the position of the price chart relative to the MA allows you to make accurate predictions for opening a deal. However, this option works in the case of a strong trend. In a situation where the price falls into sideways movements for a long time, there is a risk that the signal will turn out to be false.
If the price line, which was higher than the moving average, starts moving down and crosses the curve, this means that a sell entry point is being formed. When the chart passes from bottom to top, a signal is received to open a buy deal.
In order to assert the accuracy of the notification, use 2 MA. One of them, with a long period, gives the first signal, the second (slow) confirms it.
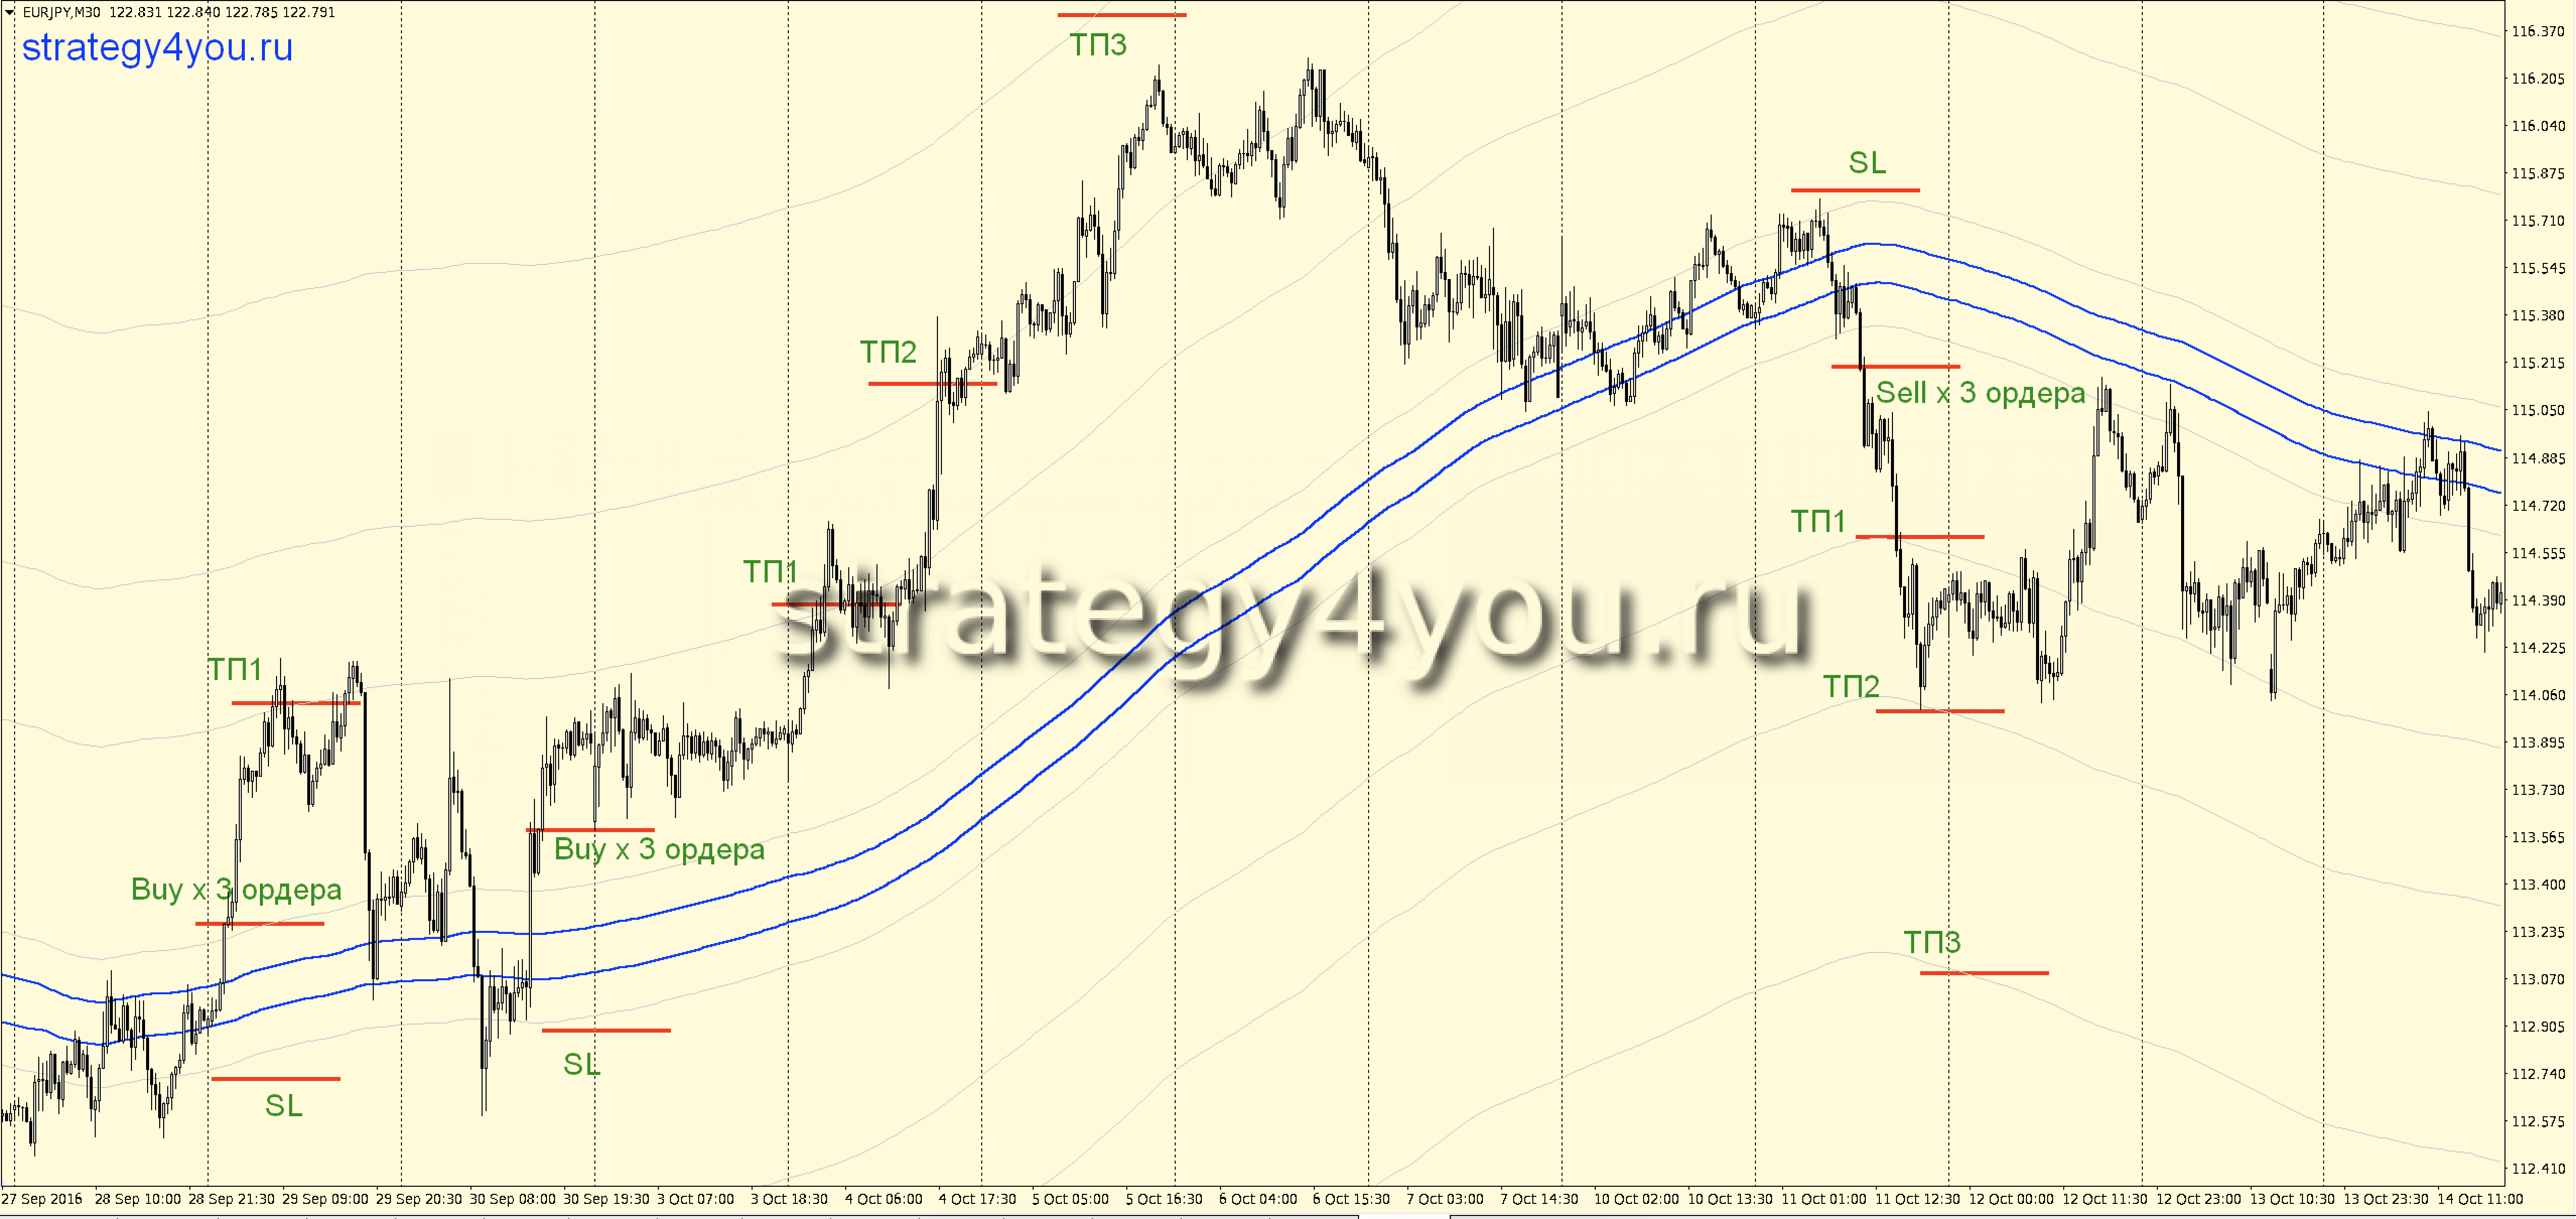
An example is the “The Sag” strategy:
The main disadvantages of strategies based on the MA indicator and methods for filtering false signals that they give
Strategies that use two (or more) moving averages have the following disadvantages:
- Lag. MA calculates the average value. This means that by the time the trader receives a signal to open a trade, the picture of the movement may change. To increase the sensitivity, reduce the period.
- Lots of false signals. A number of filtering methods have been developed to screen them out.
Apply filtering by time or price range, as well as the envelope principle.
Price range is set by the user to track the trend of a fluctuating price. After a signal arrives to open a trade, you need to wait for a confirmation notification that the situation has not changed. In order for the moving averages to reflect a more accurate picture, the range should not be too large. Otherwise, moments of potential deals will be missed.
The filtering by time range, which is also manually selected by the trader, works in a similar way. The purpose of this parameter is to get confirmation that the price has not changed direction over time.
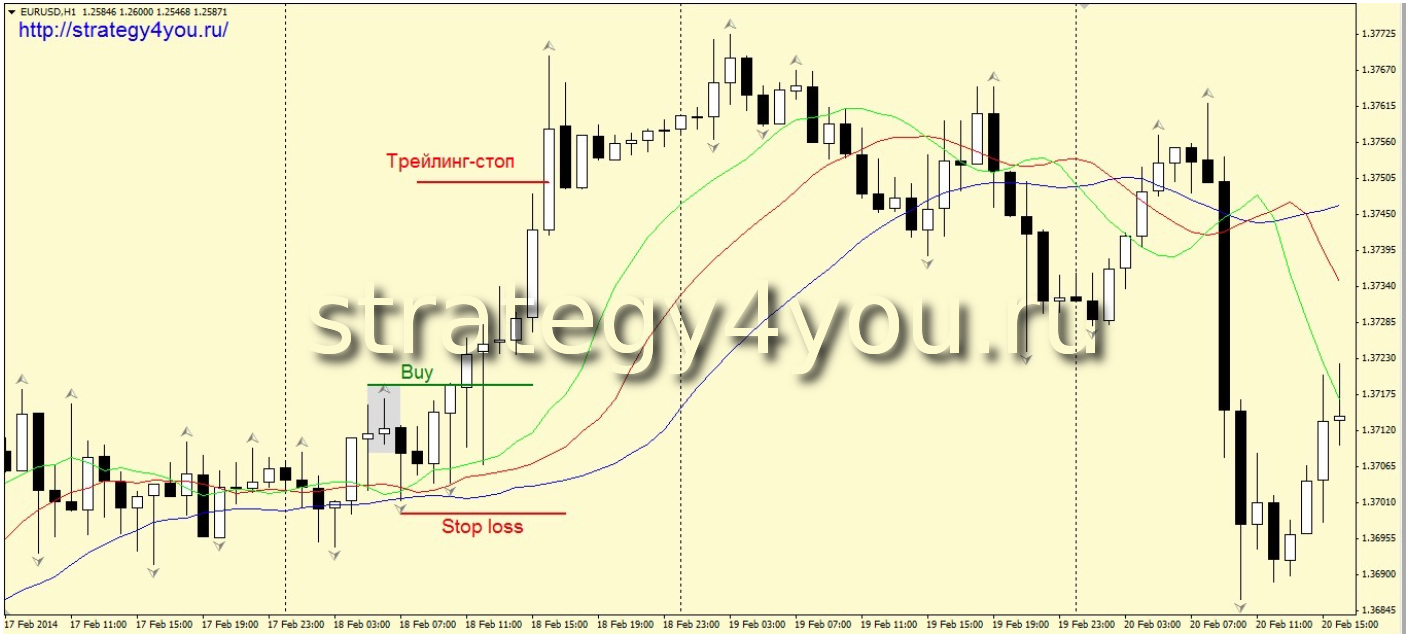
The envelope method assumes that moving averages form a band. Before selling or buying, you need to make sure that the price has passed through all the lines on the chart. To do this, build the main MA and set the percentage at what distance from it the other 2 will be.
To build such a graph, you need to go to the Envelope settings. For hourly and minute MA, changes to the default settings are required. Otherwise, the envelope will cover the entire building. For daily and weekly periods, a value of 1 is suitable, for smaller periods – 0.5 and below.
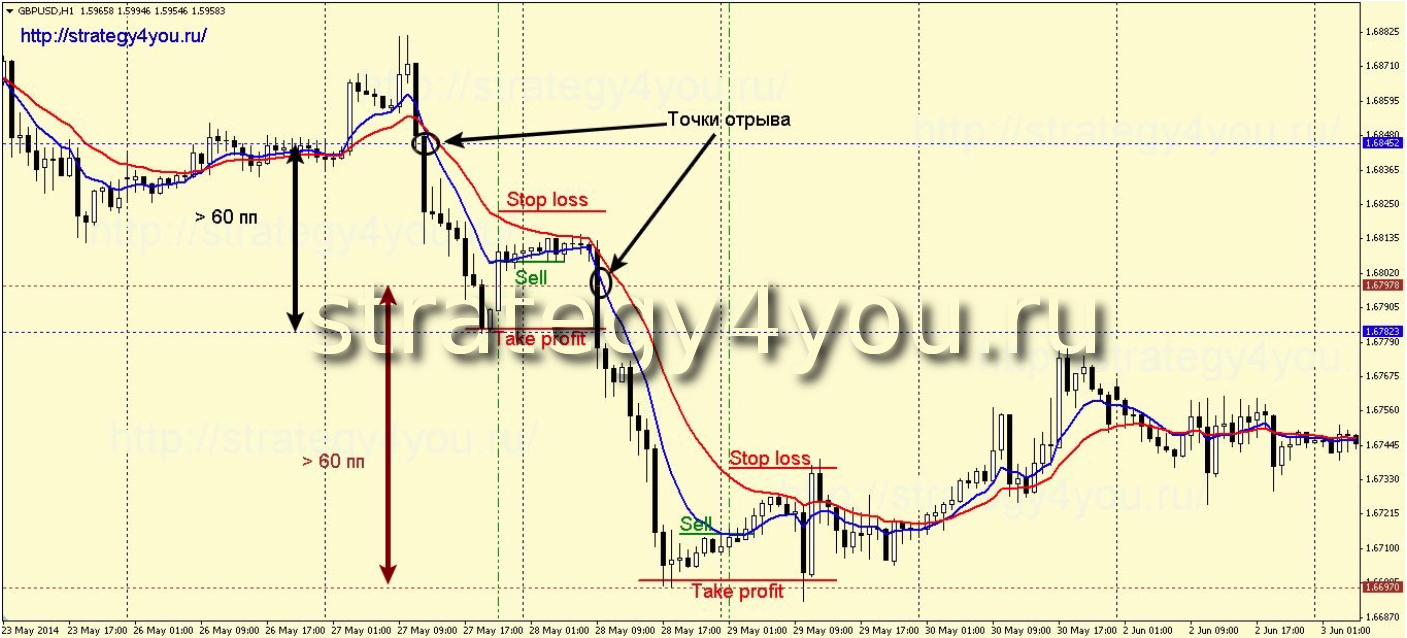
Example – Forex Strategy “Trend line & Envelopes”:
In financial markets, MAs are used as defining a strong trend. Therefore, if moving averages give a lot of fluctuating sideways signals, this indicates that their use in this case will not be effective.
Trading on the stock exchange will be associated with the risk of losing profits, since none of the moving average indicators will guarantee a result. To increase the probability of movement forecasts, it is necessary to use financial instruments in a complex, not limited to the use of one.