In the stock market, as well as forex, there are situations when a trader opens a deal on the signals of the main indicators, but after a few points it changes direction and brings a loss instead of the predicted profit. To avoid such incidents, it is necessary to learn how to read indicators of support and resistance levels for MT4, which will help determine when the price will reverse and in which direction.
What is support and resistance
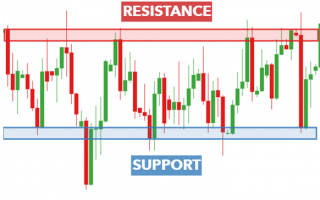
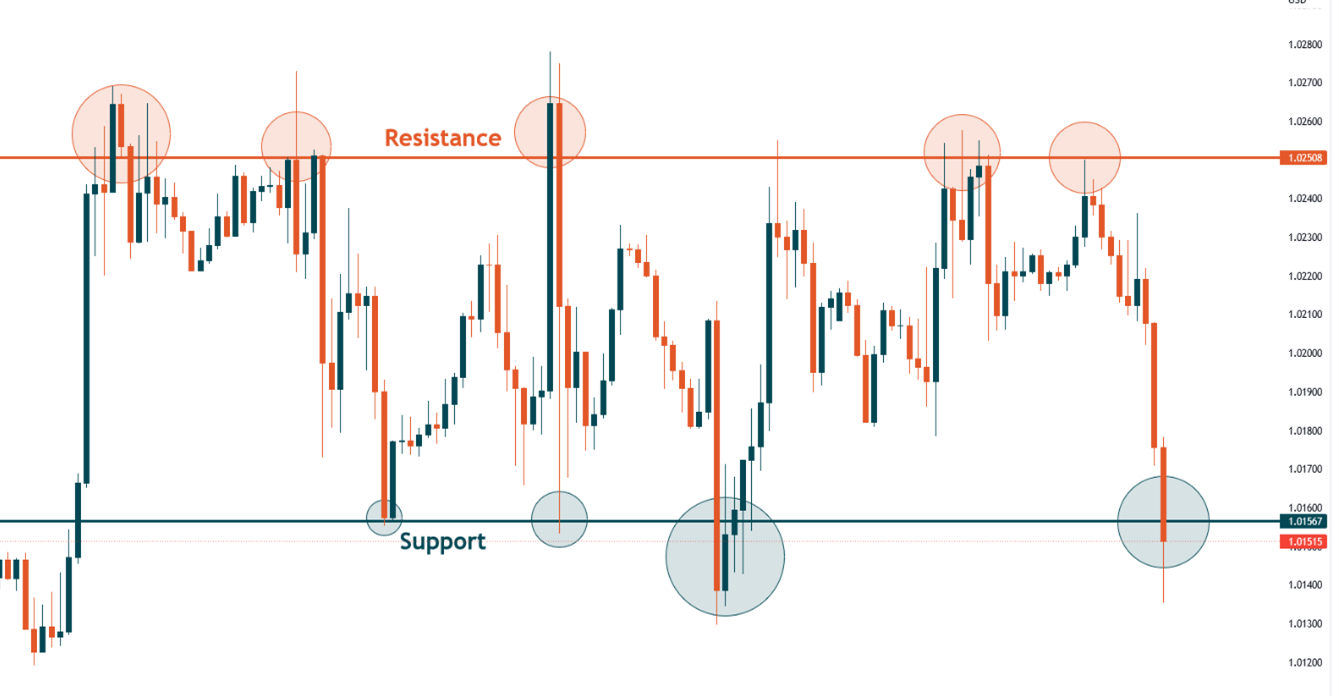
Support level is the position of the chart below the zero axis. The monitor shows how the price line grows, reaches the red line and bounces back. After a certain amount of time, the price can break through the zero axis and go up. However, with the same probability, the trend can end and leave the monitor.
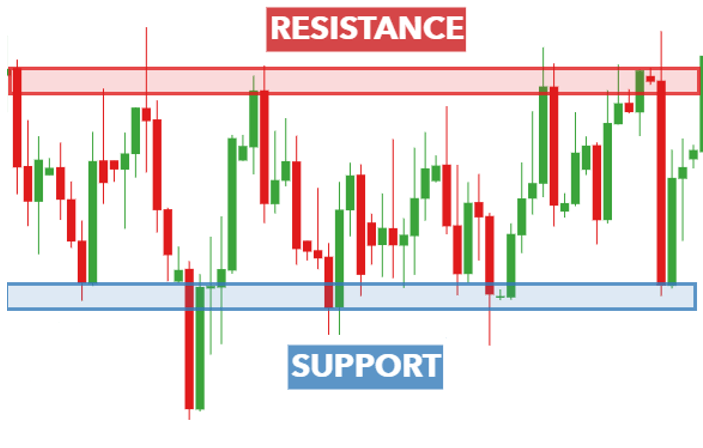
Resistance zone charts show the opposite situation. The price movement is located above the axis and, upon contact with it, bounces up again.
Such situations may be due to the following trends in the stock or currency market:- the chart cannot break through the axis due to a large number of open orders against an increase (decrease) in the price;
- there are no open trades outside this axis.
Using indicators of resistance and support areas has a number of advantages:
- makes it possible to evaluate your levels from the side and compare with other systems;
- saves time and effort on personal charting;
- exact mathematical calculation of Pivot Daily and ATR values are used, which are not built in manual mode;
- are equipped with sound alerts about favorable deal conditions.
Trading using levels
The use of indicators of support and resistance zones allows traders to make good money on trades. However, the technique will bring positive results only to those who learn to understand it and apply it in practice.
There are several basic rules that allow you to profit from indicator trading:
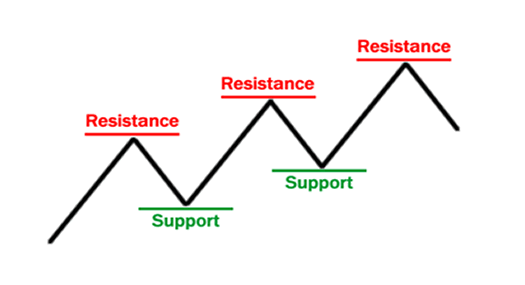
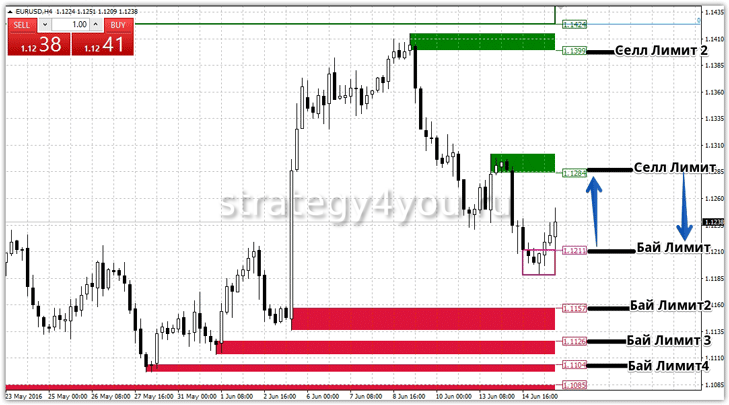
- sell orders are opened only when the price has reached the resistance level;
- currency purchase should be done only after the price chart touches the border of the support area;
- it is not always necessary to wait for full contact with the axis, if the line did not reach 1-9 points, then orders can still be opened;
- stop-losses should be set 25-30 points from the line, the exact number depends on time intervals.
The most difficult task in a trader’s work is to correctly determine the position of the zones, so stock market specialists have developed various indicators that will help analyze the situation.
Indicators
Traders around the world use various indicator options that define support and resistance levels.

- techniques that make up the classic areas based on extremes;
- systems that form Pivot Daily levels;
- indicators that create areas of support and resistance;
- strategies that are based on the mathematical theories of Fibonacci, Murray or Gann;
- programs with a built-in notification system.
SupDem indicator
The indicator is popular with experienced traders and newcomers to the market. It allows to define areas of support and resistance levels and notifies about it with a sound signal.
Software can be configured:
- colors of the upper and lower zones;
- an option that removes zones from the chart after the axis is broken;
- an indicator of the time period over which the search is performed;
- a feature that displays price information next to the zones.
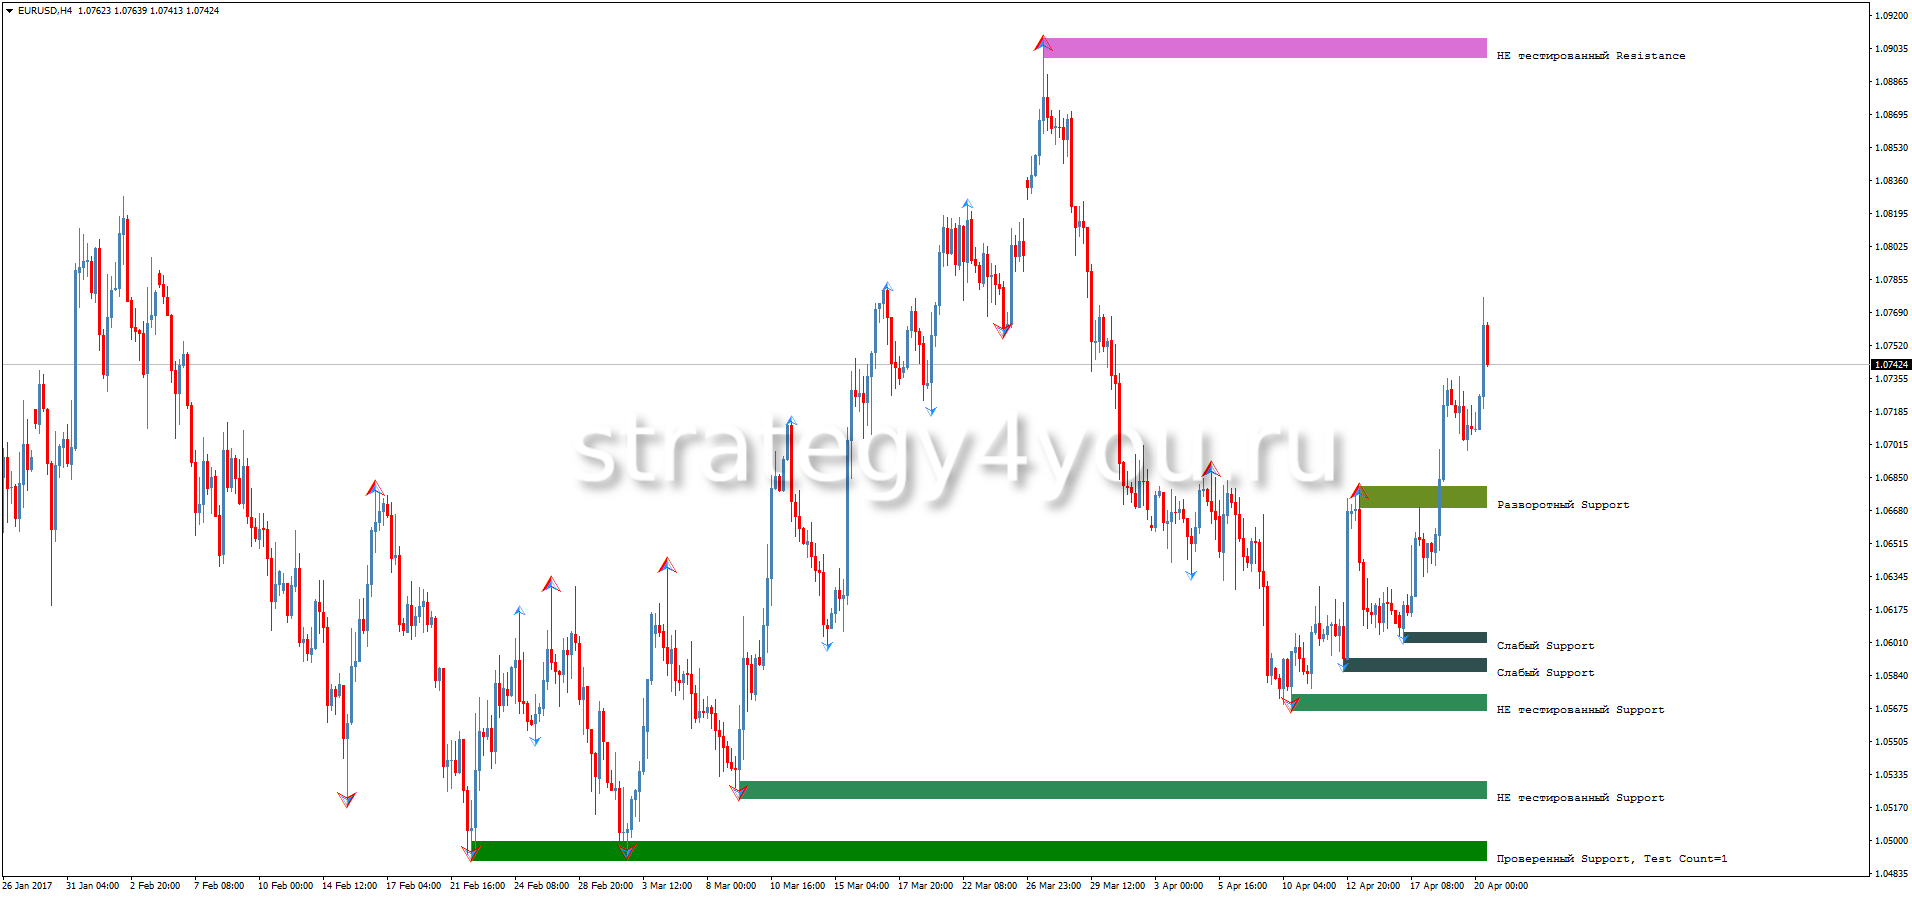
SS_SupportResistance_v06 indicator
This indicator defines areas of resistance and support based on the rebound from previous zones. The indicator tells you whether the axle has been pierced or not. Simple and easy to use, easy to set up and allows you to build charts on different timeframes.
Indicator settings include the following parameters:
- indicator that determines the maximum number of bars;
- time period for calculating levels;
- changing the color scheme of the chart and filling the necessary zones with color;
- area filtering option;
- a parameter that gives weekly levels;
- the thickness of the levels and detailed information about them (broken or not, tested, etc.);
- sound notification about the appearance of new and breaking through the old areas.
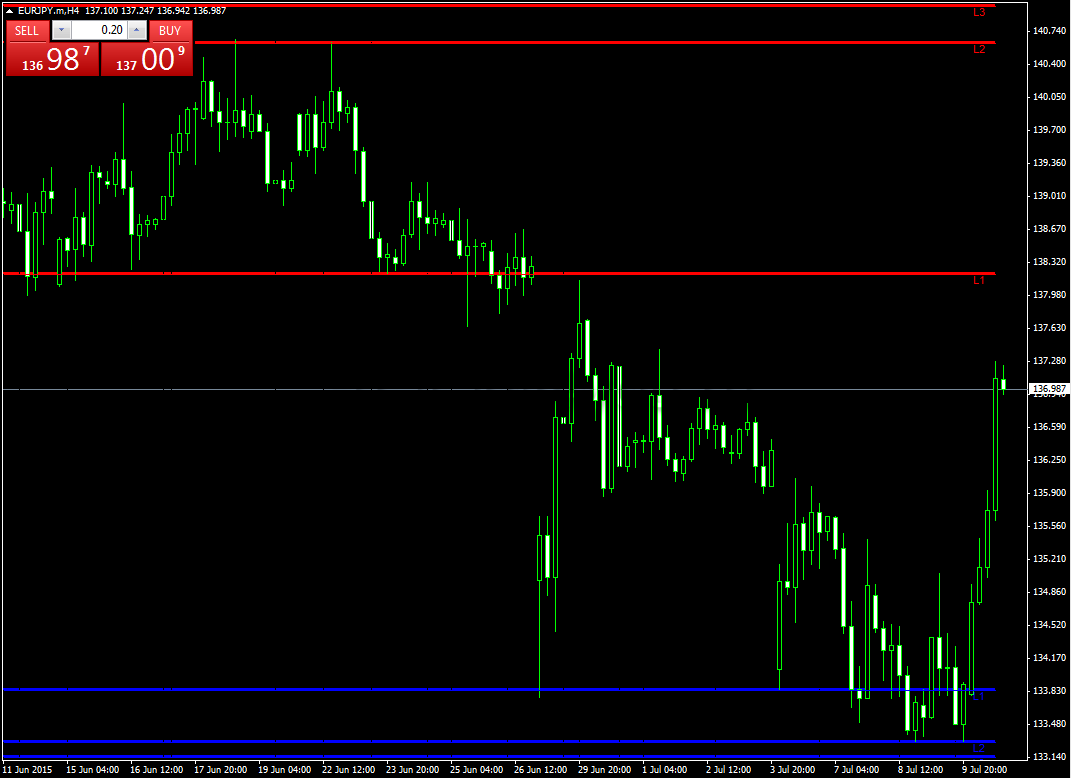
Forex Dashboard Support and Resistance indicator
Forex indicator builds a chart of levels using a mathematical formula. Equipped with an auxiliary information panel. The chart calculates the time until the close of the candle, how many points the price has broken through, its current movement and the strength of currencies in the current time mode.
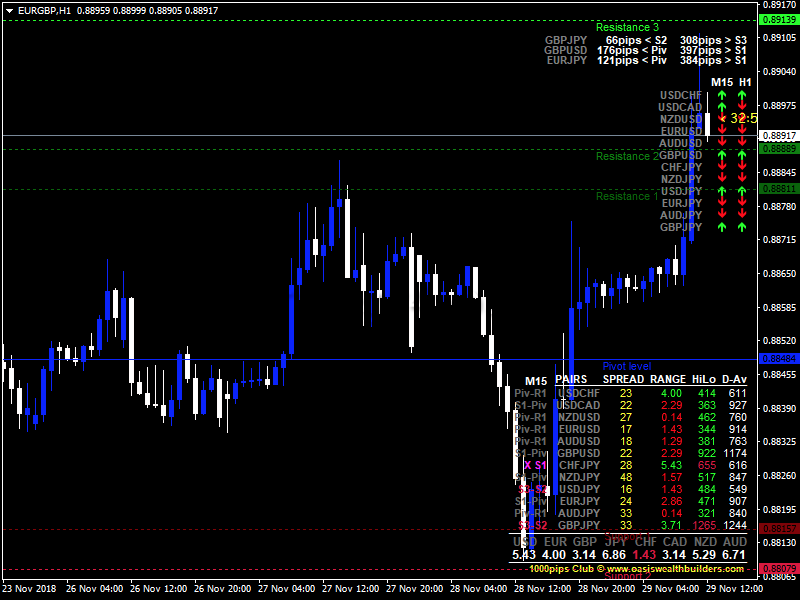
- changing the color scheme;
- an additional panel that displays the strength of the currency;
- statistics on the position, the number of points it passed, and the distance to support or resistance levels;
- data on the current candle and the countdown to its close;
- Fibonacci pivot statistics are displayed.
Kg_Support_and_Resistance indicator
The current indicator allows to build resistance (support) levels based on the maximum and minimum prices during trading. In the areas of the largest and smallest values, a small line is drawn to the right of the peak.
The algorithm is considered the best for finding axis breakouts. In the settings, you can only change the color of the lines. A special formula is used to determine peaks and breakdowns, so access to making additional settings is closed.
MTF Resistance Support indicator
The algorithm is similar to Kg_Support_and_Resistance, but is supplemented with the option to change time intervals for deeper analysis. You can display 3 timeframes on the chart at the same time. Levels are built according to fractals.
- detailed information about the levels and their options;
- function of automatic selection of parameters;
- shows the points of formation of zones;
- data of all 3 intervals on which the graph is built.
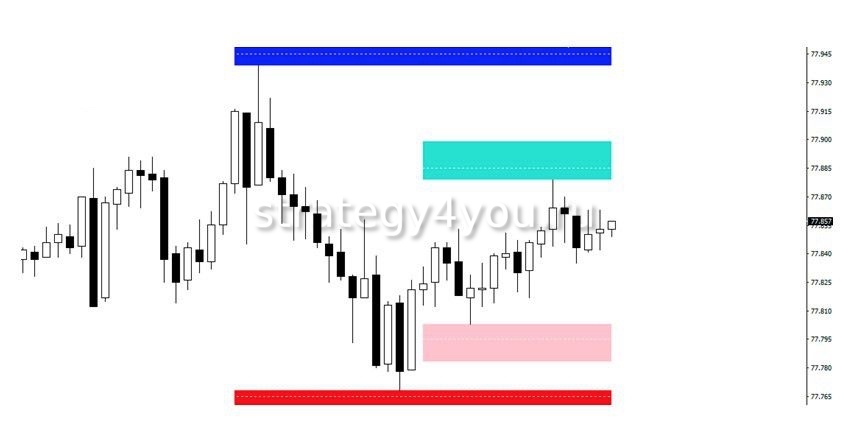
Zone indicator
It is able not only to find extremums (that is, minimum and maximum values), but also to predict price behavior by modifying the popular oscillator . The result of the calculations are rectangles, the width of which corresponds to the key range. Thus, the area of resistance or support is presented in several price categories.
The main advantage of the indicator lies in the analytics not only of the current period, but also of the time intervals specified in the settings.
PowerDynamiteAreas indicator
Refers to classic indicators for trading strategies that work on extremes. The software uses a special mathematical formula that allows you to find and display on the monitor points where the same price has occurred several times, and draws lines based on them. The indicator is not equipped with the option of independent filtering of levels and selection of time intervals. These settings can be set by the trader himself.
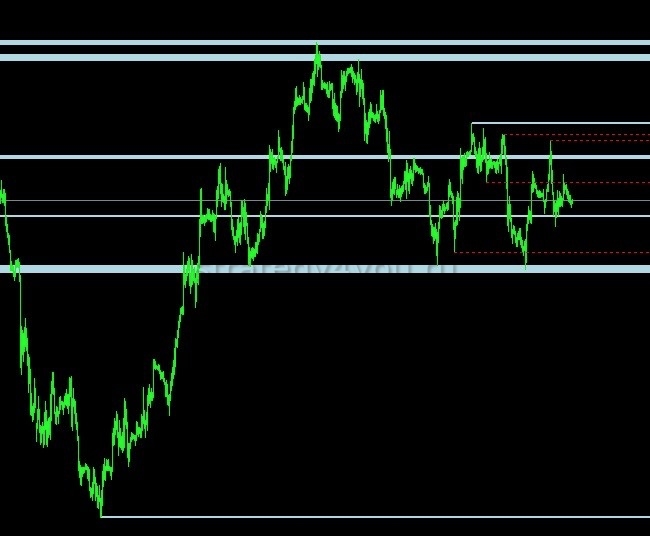
Algorithm Lines
Thanks to a complex mathematical algorithm, the indicator finds and displays 2 support lines and 2 resistance lines. The first pair of levels is responsible for the analysis of the long-term period, the second – for the data in the short-term period. For each level, you can set your own time period.
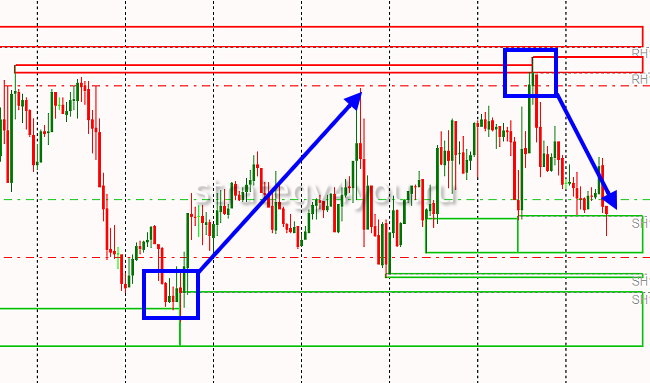
PZ levels
The method performs search and display of price intervals at which the probability of making a profit increases:
- for bulls, if the trend is up;
- for bears if the movement is declining.
Data analysis is performed at several different time intervals. The strength and size of the identified levels have different colors, widths and saturations of the horizontal lines. The stronger the trend, the thicker and darker the line. If several levels are next to each other, then they are likely to merge into one.
Murray Math
The indicator was developed by according to Murray (or Gann) theory. If explained in simple terms, it is used to find the maximum and minimum values of quotes in the analyzed period and then divide the price range into 8 areas of equal width.
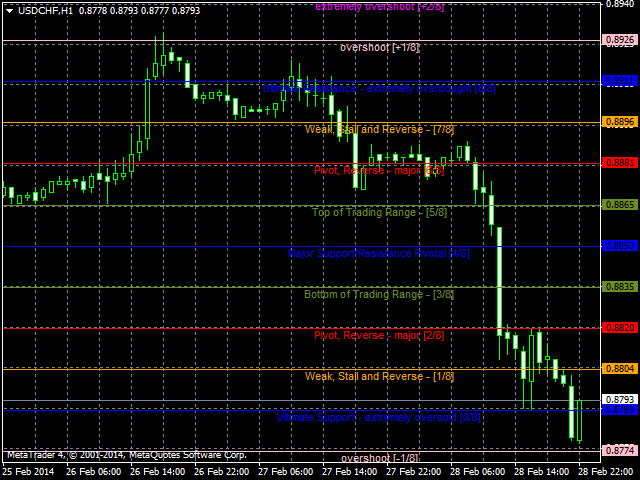
After that, the trader receives 9 main levels and 2 additional levels above and below the peak values. Each level reports on the behavior of the quote and contributes to its unfolding or braking.
Fibo Machine PRO
This indicator is based on the mathematical Fibonacci sequence, which allows you to find the sequence pattern in the pricing policy of the stock exchange, more precisely, in the location of resistance and support levels. On the graph, their values are displayed as continuous or dotted lines.
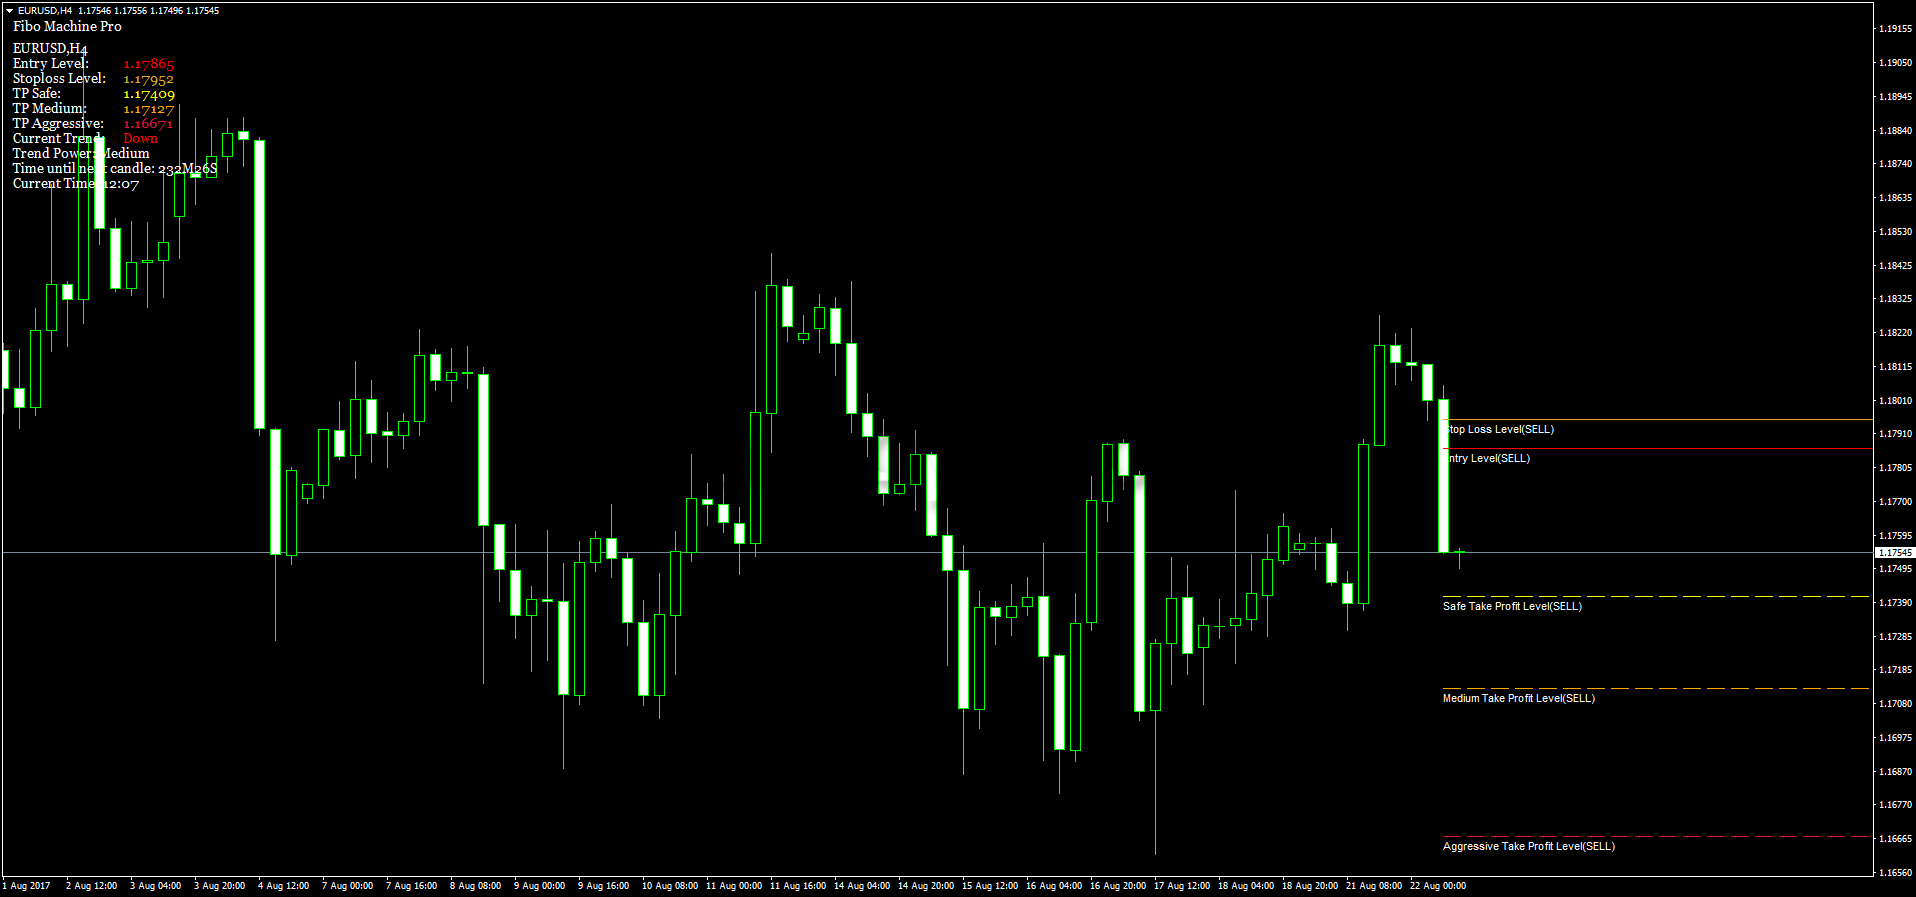
Each of them displays existing calls to action – trade entry, stop loss level and maximum profit corridor. All this data is signed and displayed on the screen. Trend information is also displayed in the upper left corner. This indicator is considered the best in its category and allows even beginners to make a profit.