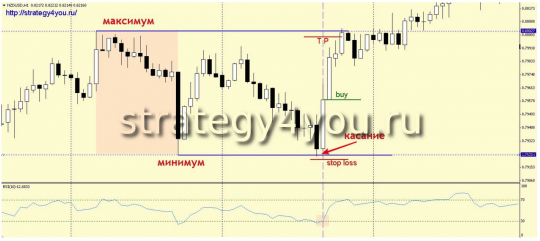
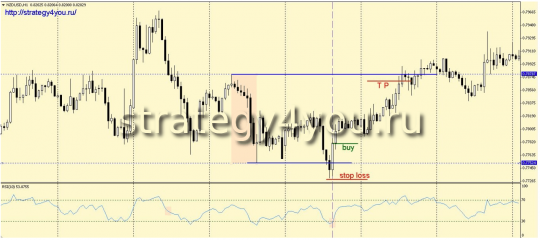
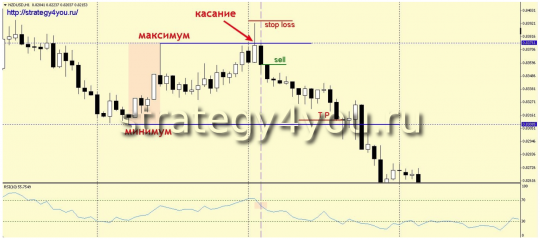
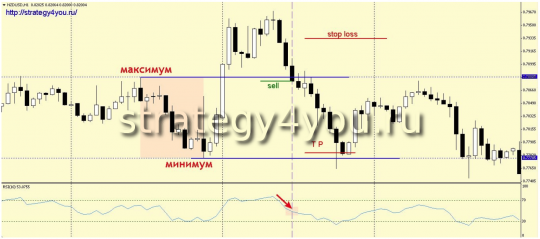
YESTERDAY [Forex & Crypto Trading Strategy] — is designed for the NZD/USD currency pair, time interval H1 and we will trade from the highs and lows of the previous day, it is possible to trade on other currency pairs, but to work with them, you should independently select the value of the RSI indicator.
Of course, from the point of view of the profit received over the past year, according to the results of the test (the results are given at the end of the article), the strategy is not the most profitable, but from the point of view of the risks taken, it looks quite impressive, which is only worth the maximum drawdown indicator (69 points !! ! — for a 4-digit broker, like f4u), but first things first…
- Currency pair — NZD/USD
- Time interval — H1
- The indicator used is RSI (10) with levels 30 and 70.
Conditions for concluding a deal to buy, according to the forex strategy Yesterday:
1) Draw horizontal lines/levels on the high and low of the previous day.
Option «a». The price touches the lower line of the resulting range. The RSI indicator is in the oversold zone or has just come out of it and shows an increase.
Option «b». The price rewrote the low of the previous day and during the same day it returns above the lower horizontal line. The RSI indicator is in the oversold zone or has just come out of it and shows an increase.
2) At the opening of the next hourly candle, open a buy trade.
3) Stop-loss is set below the last minimum, but not less than 30 points and not more than 50 points.
4) Take profit is set on the opposite side of the range, but not at the level of the maximum value of the candle (peak of the tail), but at the closing/opening level (the maximum value of the body of the candle).
5) After the price passes 20 points in the positive zone, the order should be transferred to breakeven.
Conditions for concluding a deal to sell — Yesterday:
1) We draw horizontal lines according to the maximum and minimum of the previous day.
Option «a». The price touches the upper line of the resulting range. The RSI indicator is in the overbought zone or has just come out of it and shows a decrease.
Option «b». The price rewrote the high of the previous day and during the same day it returns below the upper horizontal line. The RSI indicator is in the overbought zone or has just come out of it and shows a decrease.
2) At the opening of the next hourly candle, open a sell trade.
3) Stop loss above the last high, but not less than 30 points and not more than 50 points.
4) Take profit on the opposite side of the range, but not at the level of the maximum value of the candle (low of the tail), but at the level of closing/opening (the minimum value of the body of the candle).
5) After the price passes 20 points in the positive zone, the order should be transferred to breakeven.
Additions to the forex strategy:
1) After the conclusion of a deal from one of the borders of the range, we do not trade from the opposite border on this day. That is, if during the day the first signal to buy was received, then on the same day we no longer sell.
2) Signals received during the last three candles of the day are not used.
3) In the case when a stop loss is triggered, but the price still returns to the range and we get a signal according to the second option, we should re-enter.
4) The order is held until one of the exit options described above works. The only exception is when at the close of the day the price is very close to the opening level of the transaction (3-7 points). In these cases, it is recommended to exit the market (*optional).
5) Active orders do not interfere with making deals during the new day.
Forex strategy statistics from January 2013 to January 2014:
Total profit (in pips) — 1447.
Total profit (the sum of all wins (pp)) — 2082.
Total loss (sum of all losses) — 635.
The maximum drawdown in pi is 69!
Recovery factor — 20.97!
Profit factor (profit to loss ratio) – 3.28.
Reliable profit factor (ratio of profit to loss), without taking into account the maximum profitable transaction — 3.21.


![YESTERDAY [Forex & Crypto Trading Strategy]](https://strategy4forex.com/wp-content/cache/thumb/b0/0f4ce5667809bb0_320x200.png)