Test forex scalping strategy “Indy”, based on the signals of 3 indicators: EMA10, MTF Moving Average, Color RSI v1.01. You will find a detailed description of the terms of trade at the link published above ↑↑↑
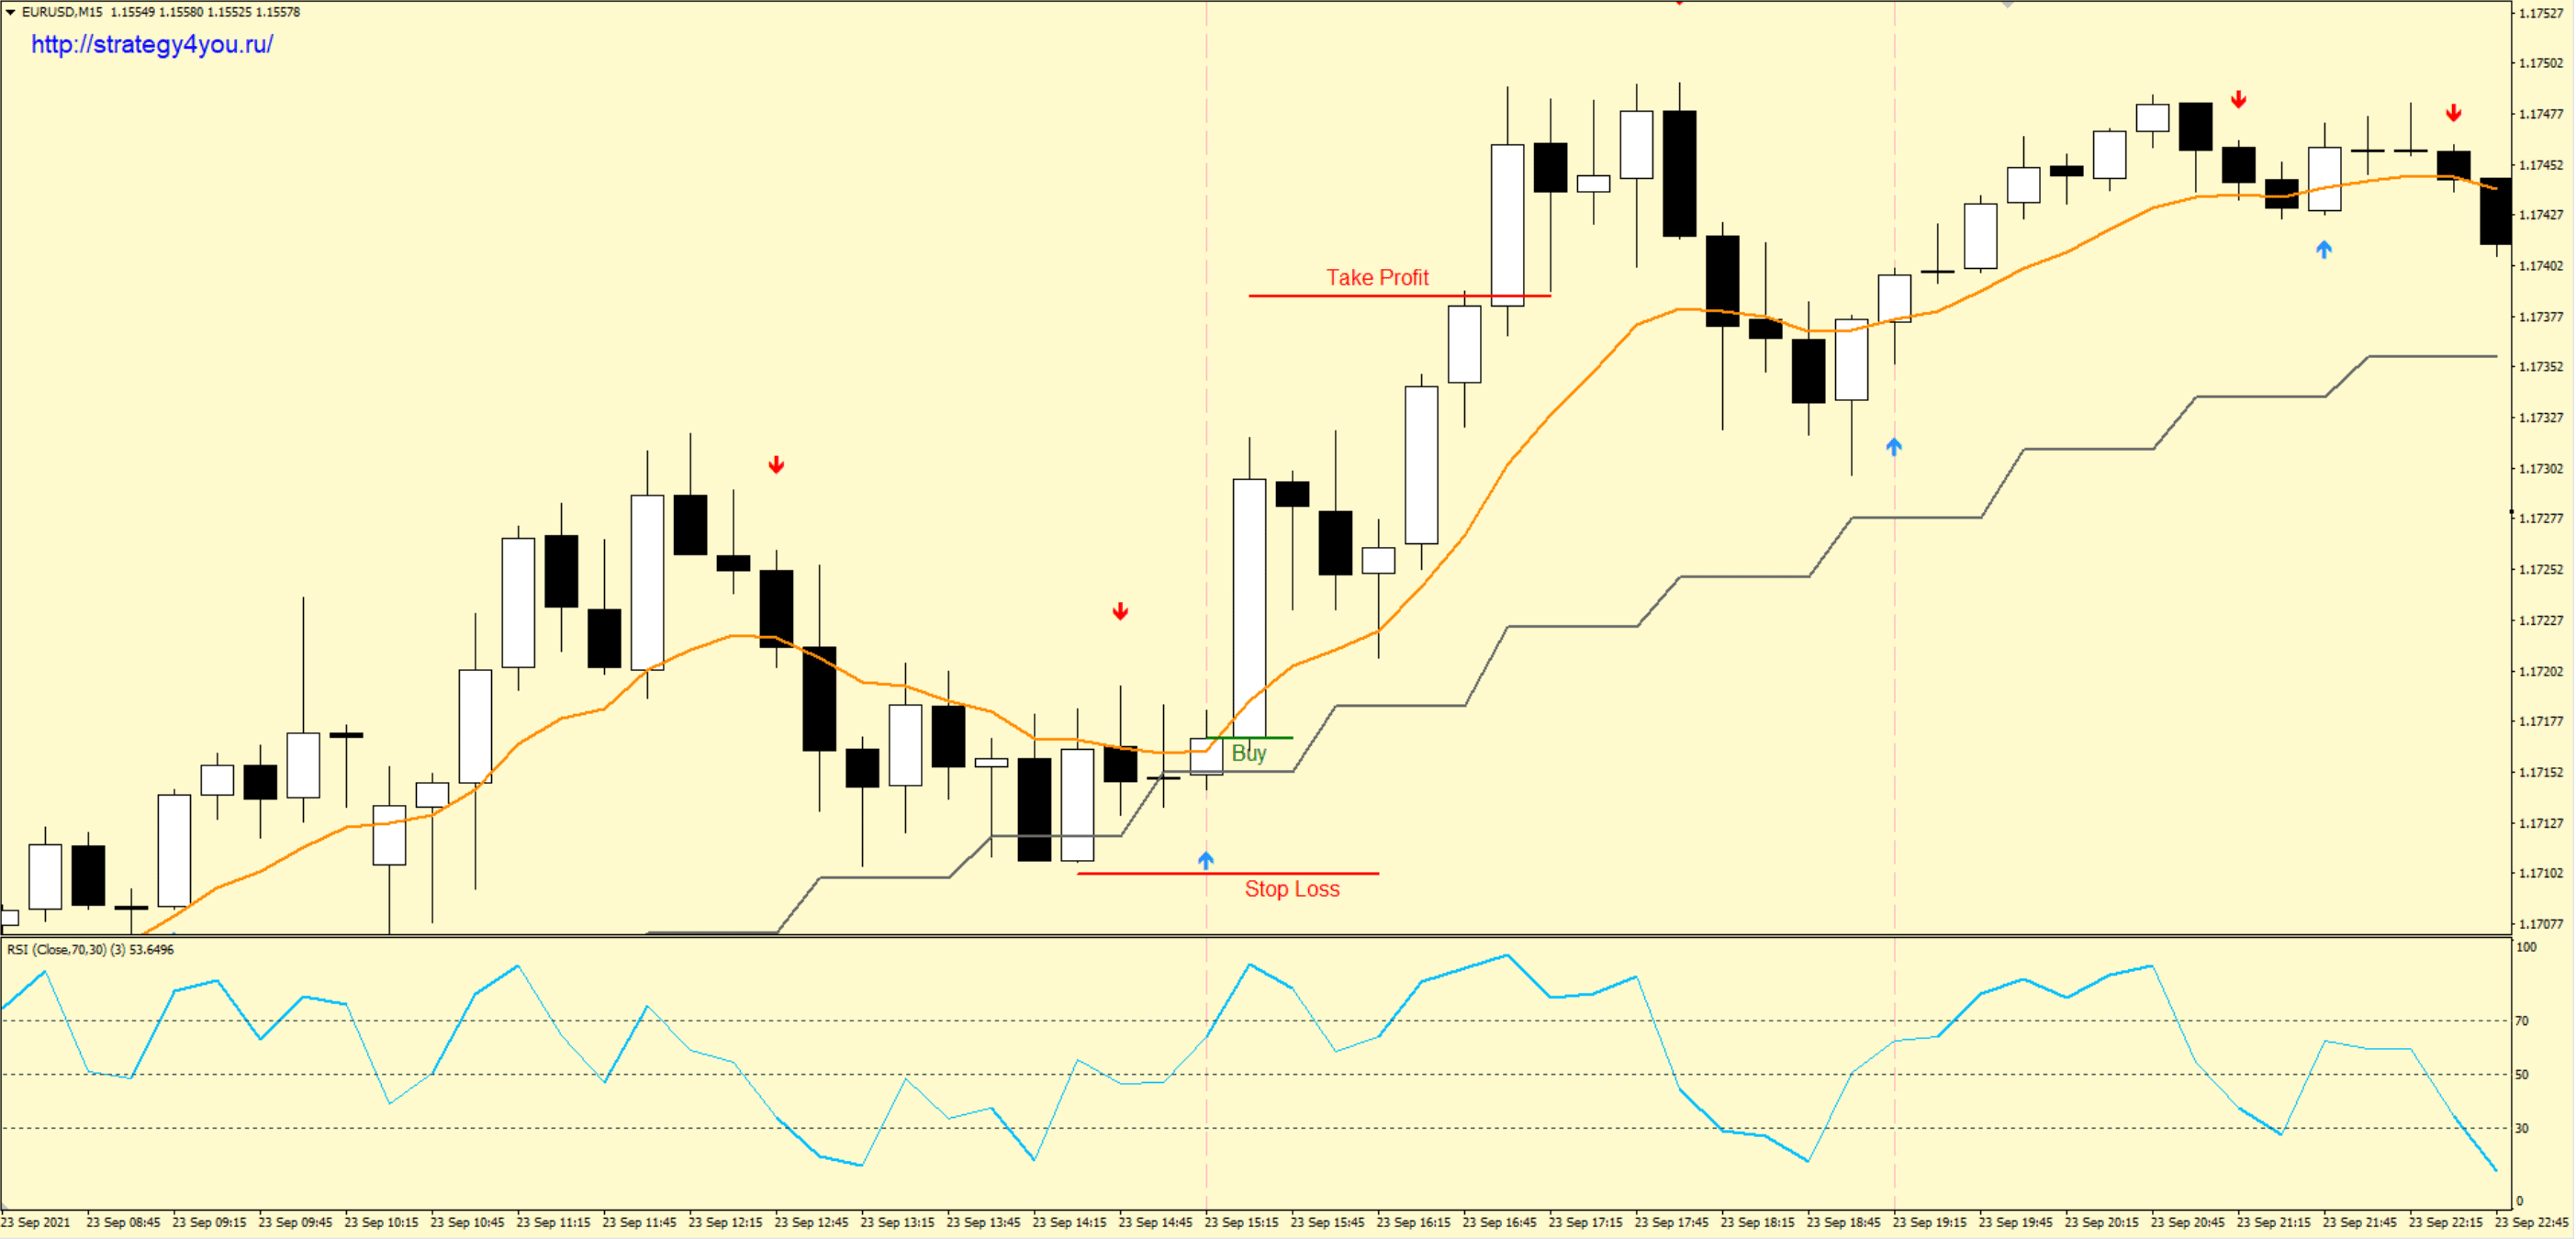
Trading is carried out on the pair:
- EUR/USD,
- interval – M15.
Profitability chart for the INDI trading strategy from April 1, 2022 to September 29, 2022 inclusive (6 months):
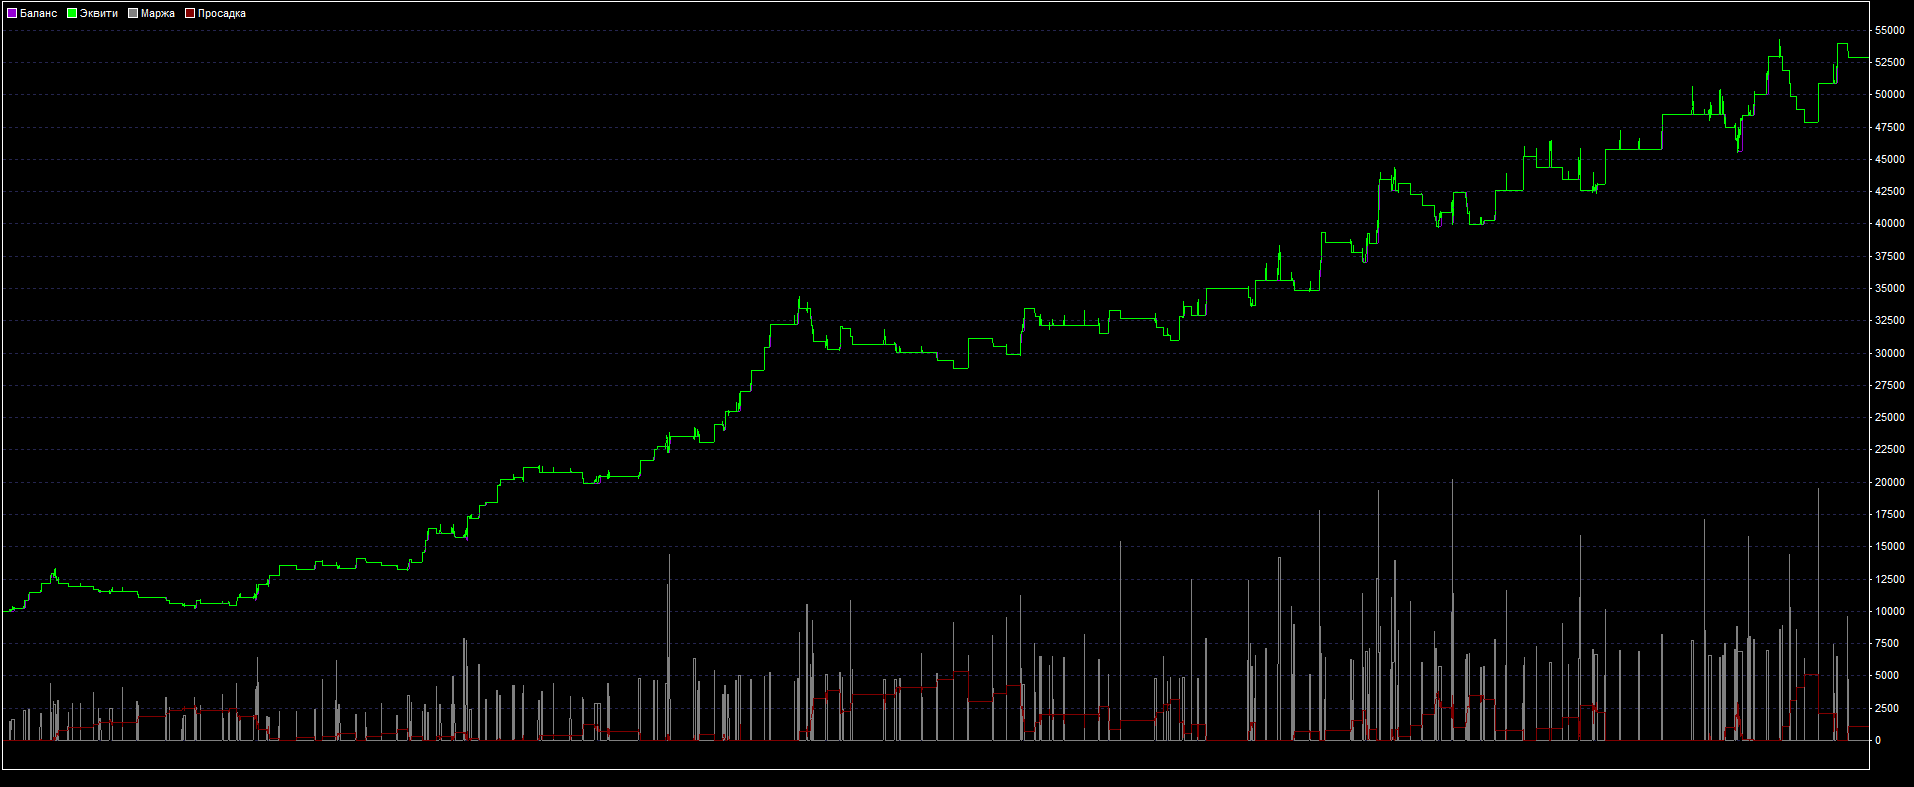
The 12-month yield chart is ascending with periodic drawdowns, which are again replaced by growth.
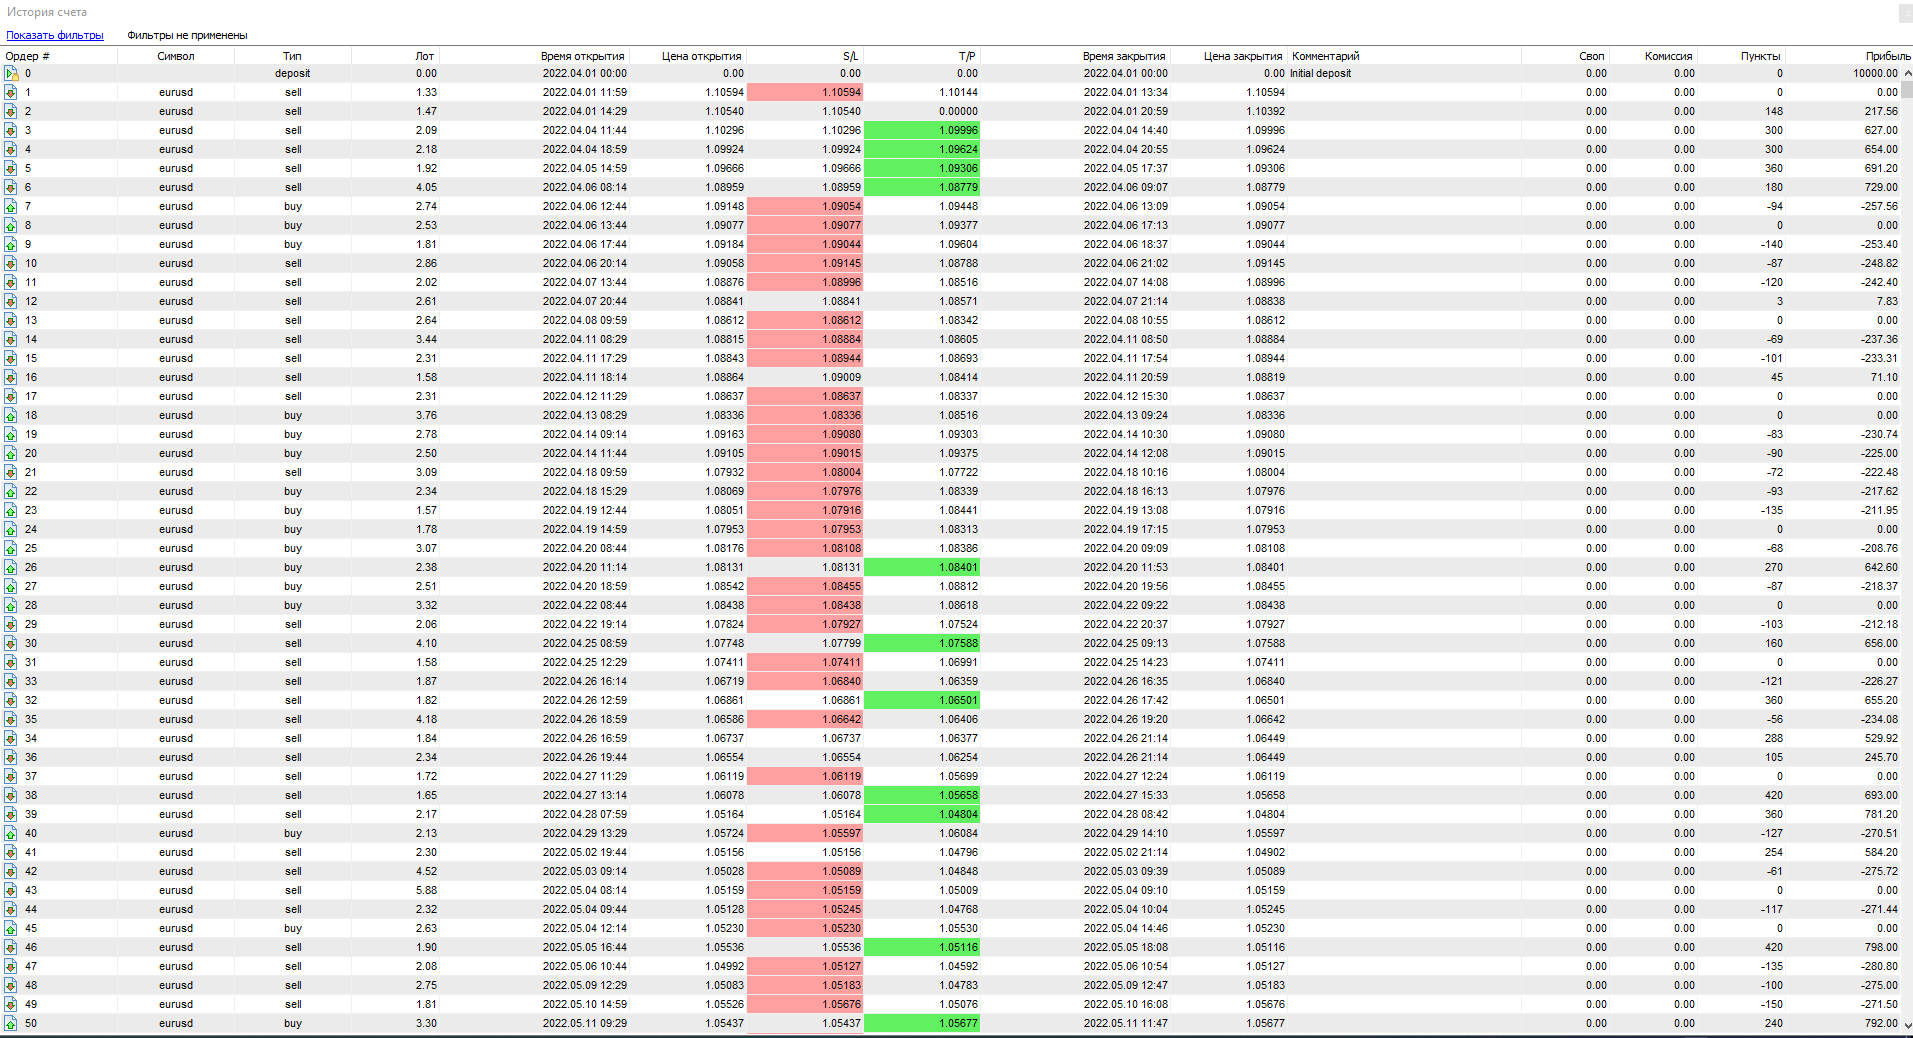
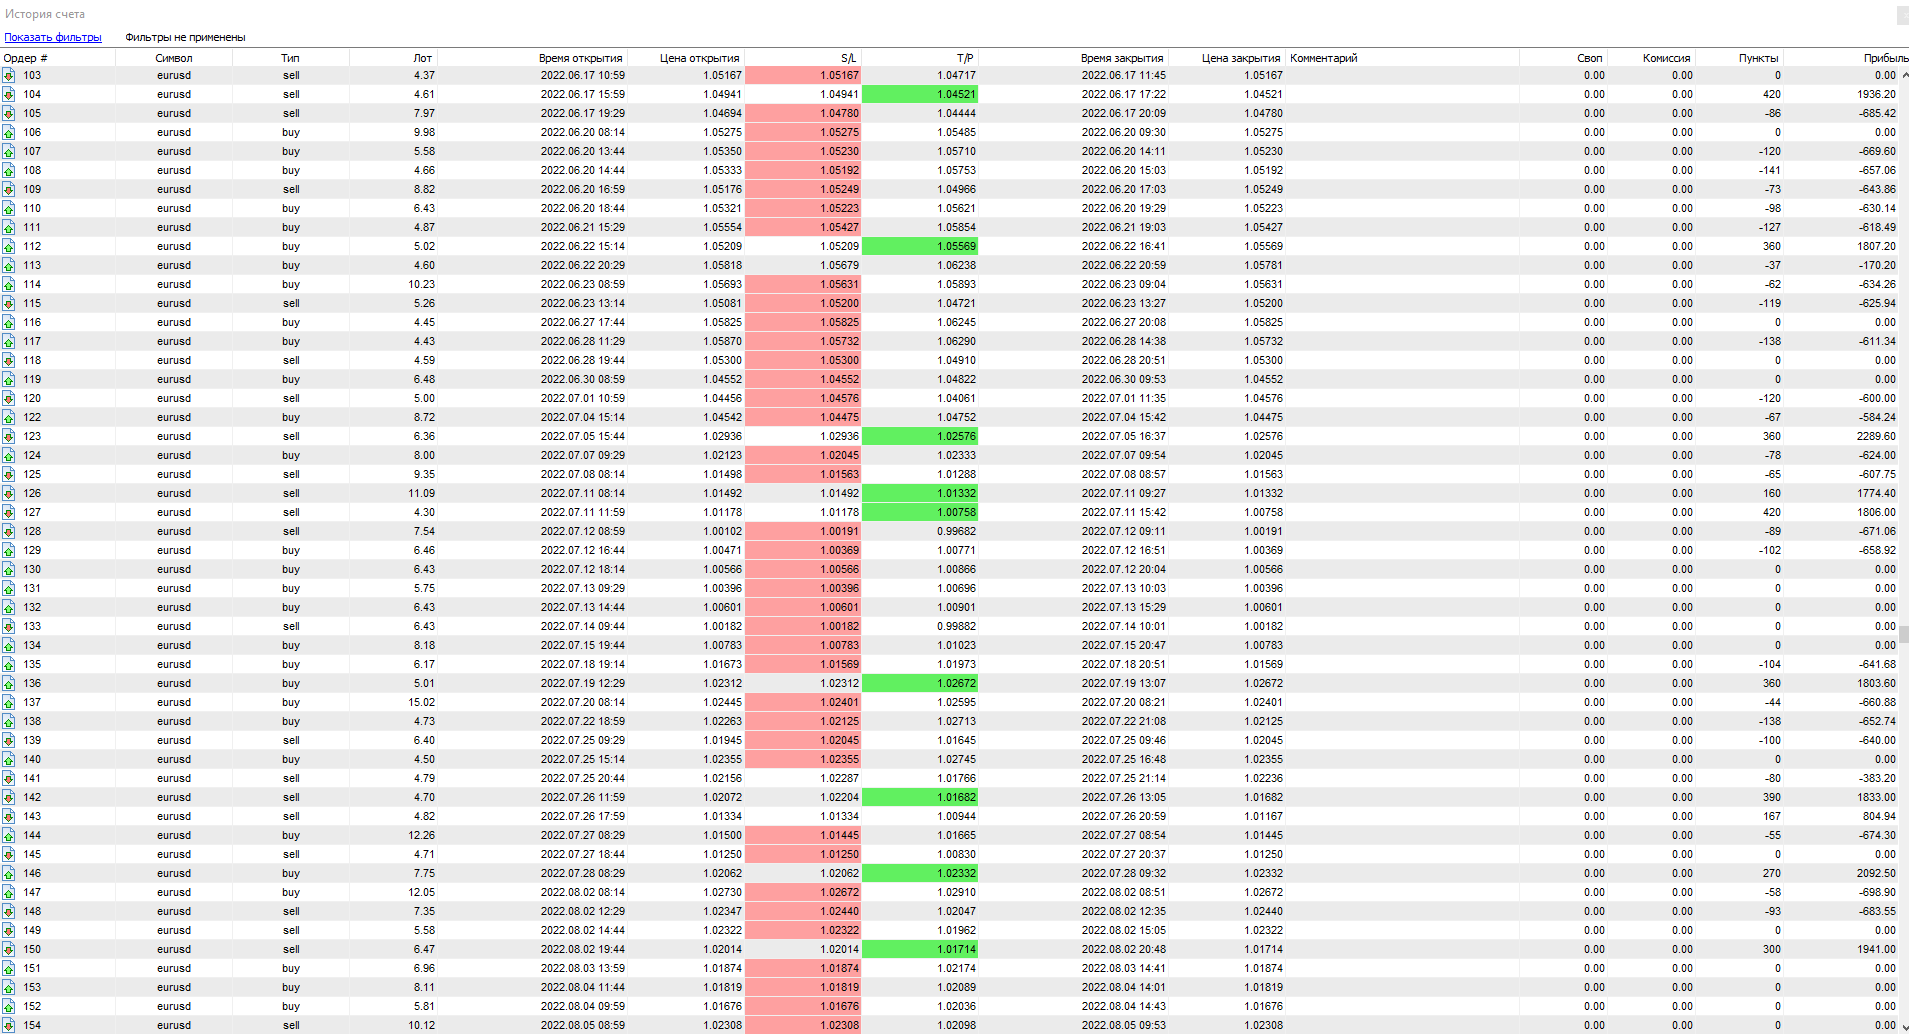
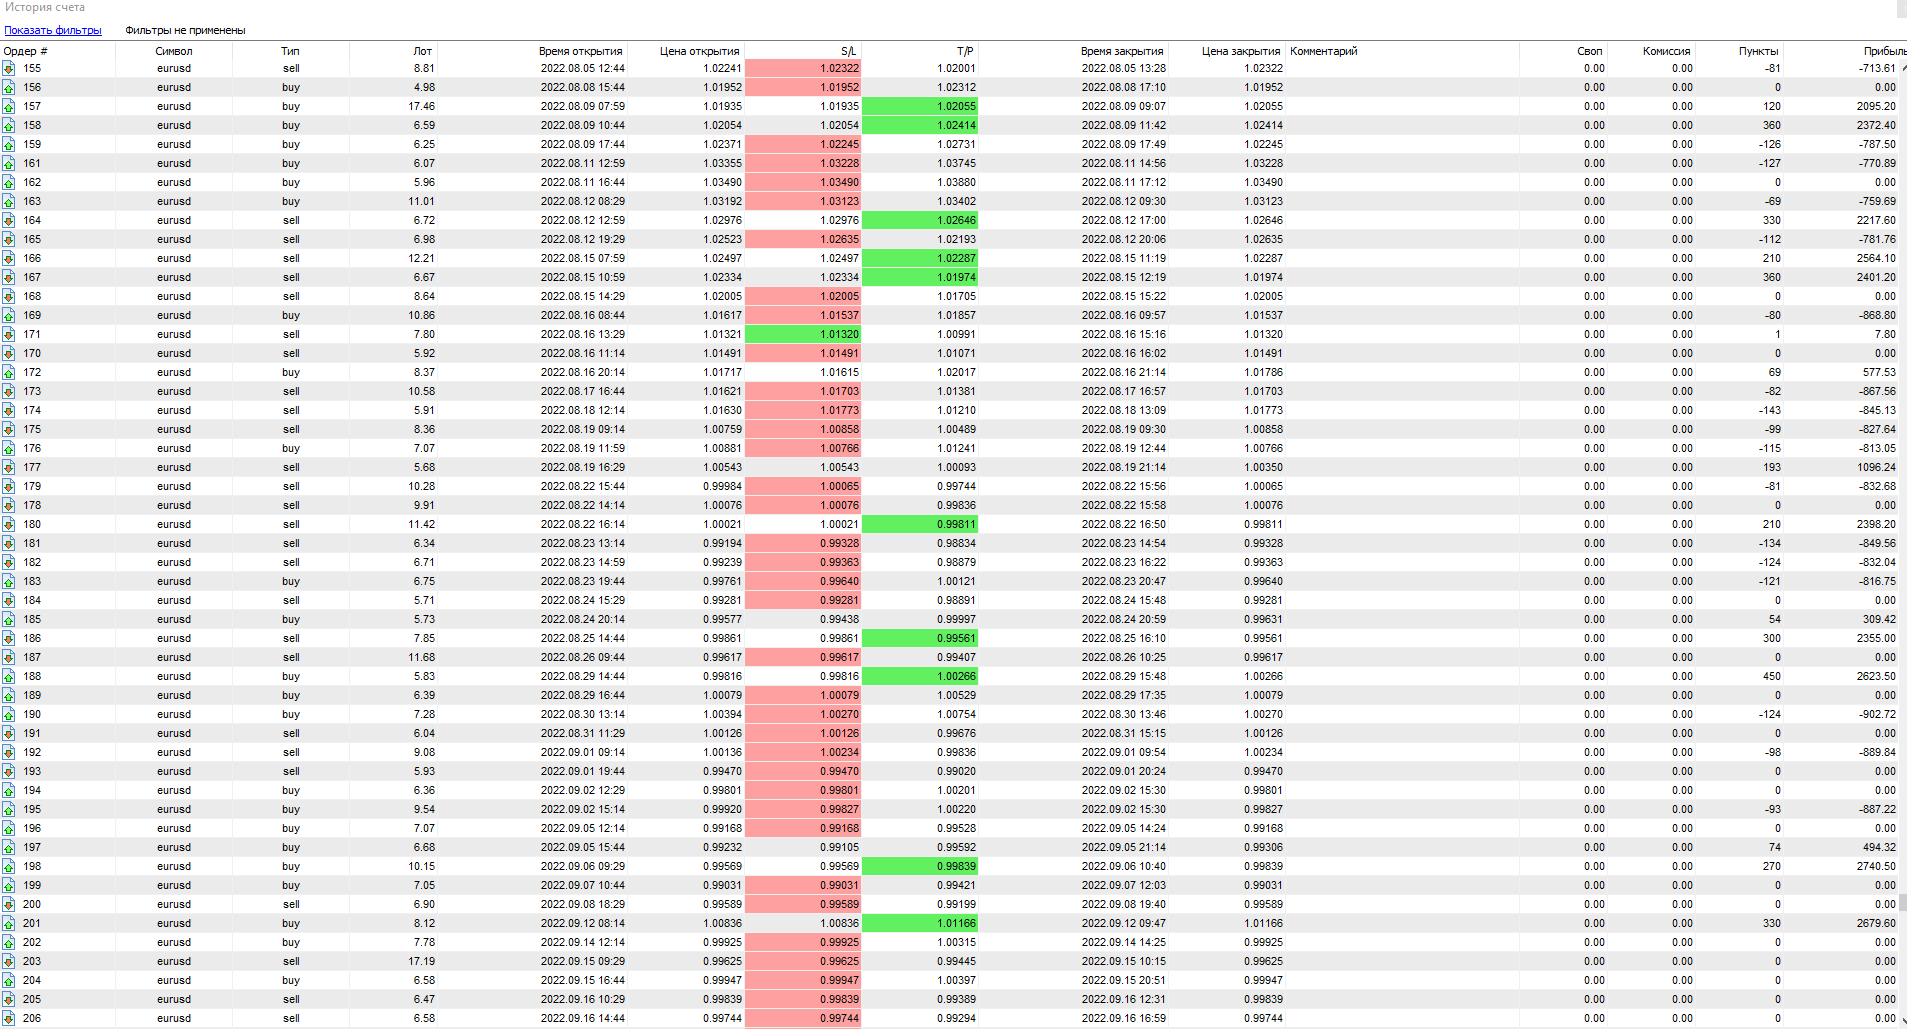
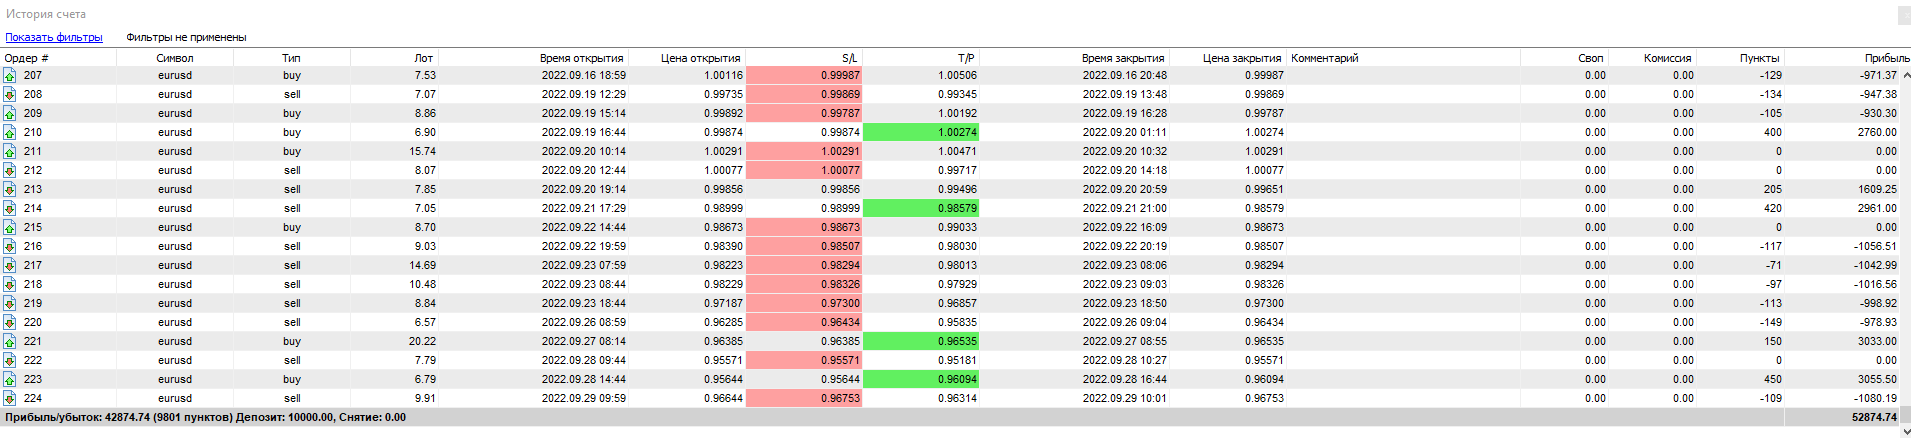
Detailed statistics on the INDI strategy are presented in the table below:

In just 6 months of testing the system, 221 transactions were opened. Of these, only 70 were closed with a profit. 84 were unprofitable, the rest were closed at zero.
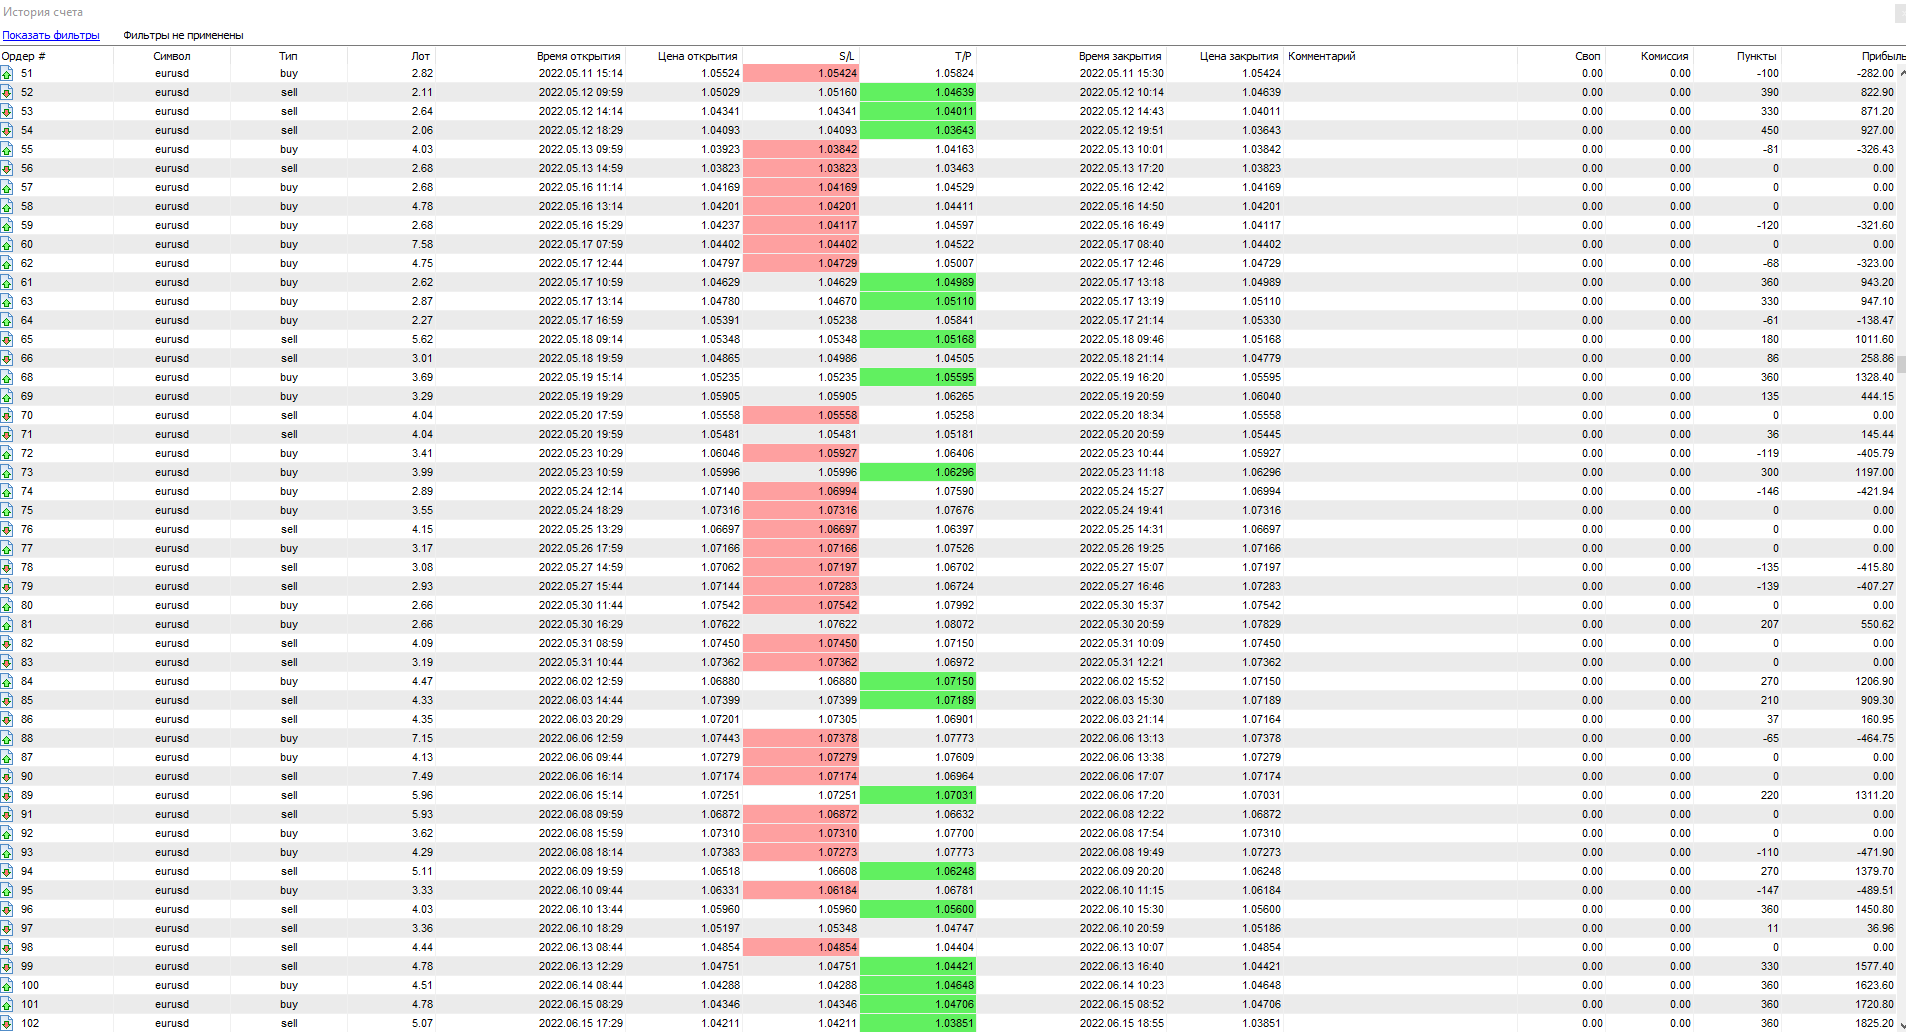
See below for a detailed report on all deals made:
Video on testing the Indy trading strategy:
- Recommended to watch with English subtitles!
If you have additional questions about this trading system or the test itself, then ask them in the comments below (under this post) – we will try to answer them as soon as possible!
The result is good, because if you like the TS, then you can safely use it in your portfolio (provided that you strictly follow its rules).