Today we will look at the Long Island pattern, which was discovered by Thomas Bulkowski in the process of observing and studying the features of the island reversal pattern, we recently reviewed it on this site earlier , and it is based on price gaps.
These patterns have some similarities (they are based on a price range separated on both sides by gaps), but if you know exactly their formation conditions, it is almost impossible to confuse them. Unlike the “island reversal”, the “long island” pattern portends a continuation of the previous trend.
This model has one drawback – it does not have clearly defined rules for entering the market, there are only suggestions and recommendations. This is due to the fact that despite the fact that the target level has been worked out in most cases, at the moment when the pattern is fully formed, it is quite difficult to determine the size of a possible rollback against the expected direction, that is, there is no need to talk about minimum stops here.
In any case, this model can be of great benefit. Even if you do not intend to trade on it separately, then it can be used as a very strong additional signal to your working forex strategy.
- Currency pair – any.
- The time interval is daily. On smaller TFs, it can also be used, but there the risks will already be greater.
Before starting to get acquainted with the description of this pattern, we recommend that you familiarize yourself with the definitions of “gap with a pullback” and “gap with a breakout”, which are described in the article for the “island reversal” pattern.
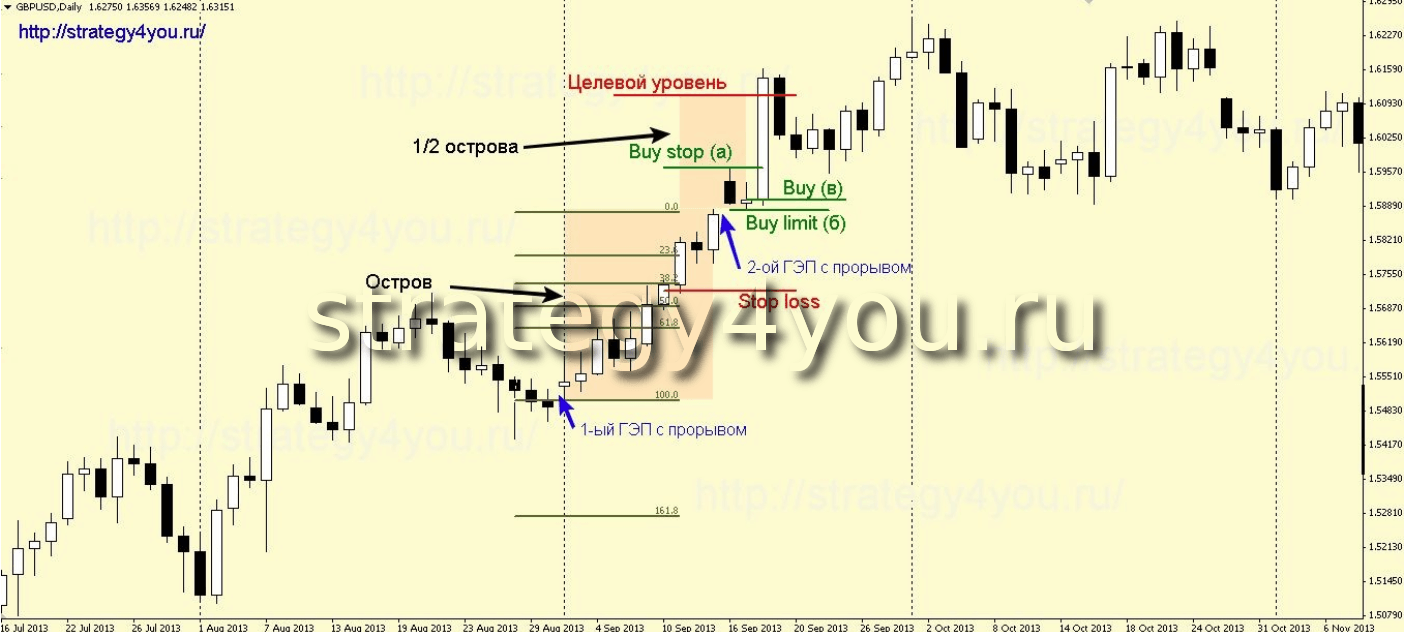
Bullish pattern of the Long Island Pattern:
1) On the upward movement, a price gap appears – a gap, after which the price continues to move up.
2) After some time, a second gap is formed, and both of these gaps must be at different price levels, that is, the first gap is located below the second.
The price range located between these two gaps is the very island.
Options for opening positions:
a) As soon as the first candle closes after the second gap, a buy stop order is placed above its high.
b) We expect movement towards the gap coverage (and not necessarily its complete closure), after which we wait for the first white candle to appear and enter the market at its close.
c) We place a buy limit order at the level of the maximum value of the candlestick preceding the gap.
Also, all these options can be used together, that is, it will divide the usual lot into three parts and try to enter all three options, which one does not work, we delete.
3) Setting a safety order (stop loss)
a) beyond the Fibonacci level of 38.2 stretched from the minimum to the maximum value inside the island.
b) for the last expressed minimum.
In the case of entering the market according to the first option, you can consider the option of setting a stop behind the minimum value of the last rollback.
4) To determine the level of profit fixation, you should perform the following actions:
– measure the size of the entire island
– split it in two
– postpone the received value, upwards starting from the maximum value of the island.
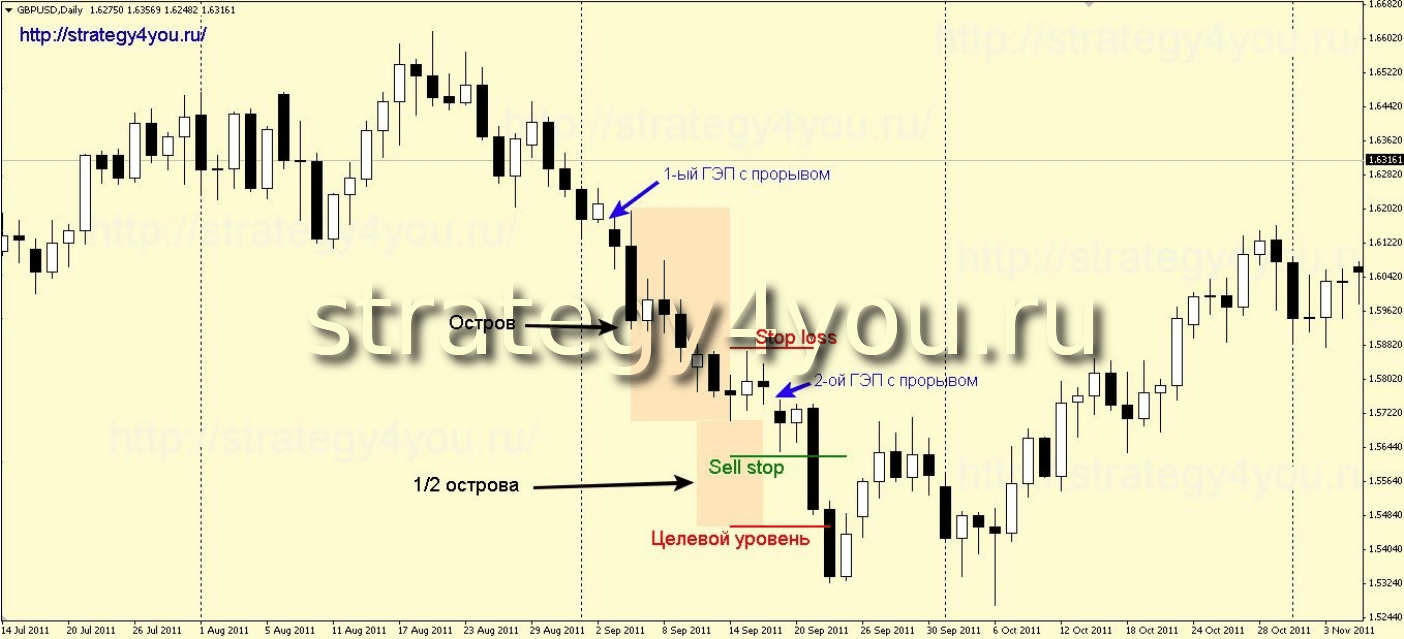
Bearish pattern of the Long Island Pattern:
1) A price gap (gap) appears on a downward movement, after which the price continues to move down.
2) After some time, a second gap is formed, and both of these gaps must be at different price levels, that is, the first gap is located above the second.
The price range located between these two gaps is the very island.
Options for opening positions:
a) as soon as the first candle closes after the second gap, a sell stop order is placed under its low.
b) we expect movement towards the gap coverage (and not necessarily its complete closure), after which we wait for the first black candle to appear and enter the market at its close.
c) place a sell limit order at the level of the minimum value of the previous gap candle.
Also, all these options can be used together, that is, it will divide the usual lot into three parts and try to enter all three options, which one does not work, we delete.
3) Setting a safety order (stop loss)
a) beyond the 38.2 fibonacci level stretched from the maximum to the minimum value inside the island.
b) for the last expressed maximum.
If you enter the market according to the first option, you can consider setting a stop loss beyond the maximum value of the last rollback.
4) To determine the level of profit fixation, you should perform the following actions:
– measure the size of the entire island
– split it in two
– postpone the received value upwards, starting from the maximum value of the island.
Additional terms and comments:
1) The larger the gaps, the better.
2) The smaller the price range inside the island, the worse.
3) If several islands are formed within one trend at once, and each subsequent island is smaller than the previous one, then this is a clear sign of the imminent end of the trend.
4) it is desirable that inside the island, and indeed the trend itself, there are as few rollbacks in the opposite direction as possible, it is better that the trend is evenly and stably directed.
5) Ideally, both gaps should be with a breakout.
6) If the first gap turned out to be with a rollback, then such a model should be traded with extreme caution.
7) If the second gap turned out to be with a rollback, then if you trade such a model, then only after the closing of the gap and the census of the last extremum.
8) The model formed immediately after the change of the previous trend (not far from the extreme value) performs much better.
9) When trading stocks in an uptrend, targets can be much larger than those originally proposed for this model.
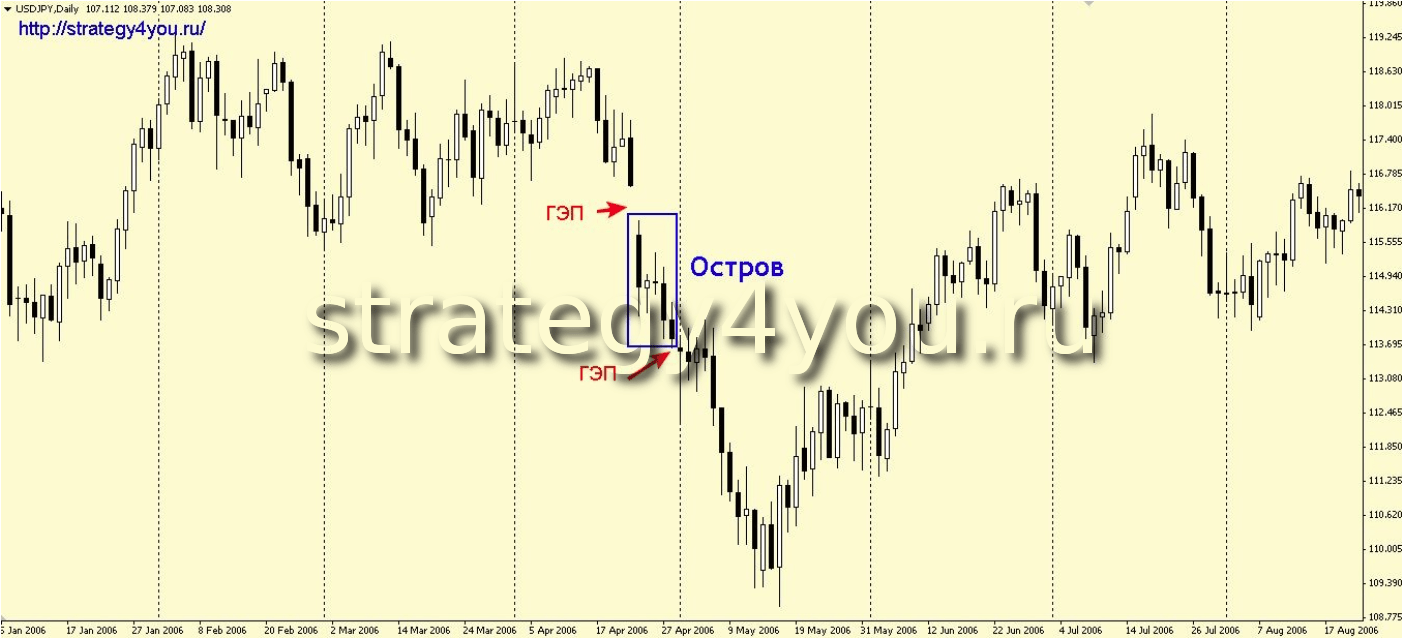
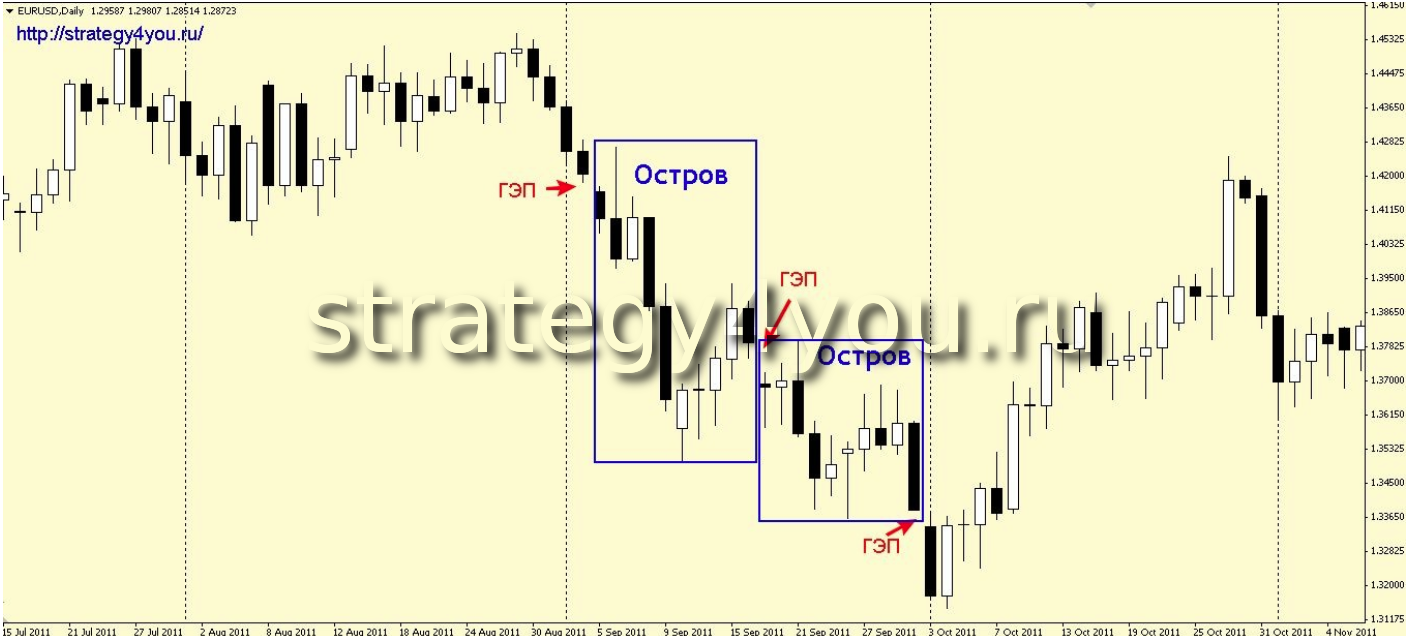
A few real examples:
Example 1:
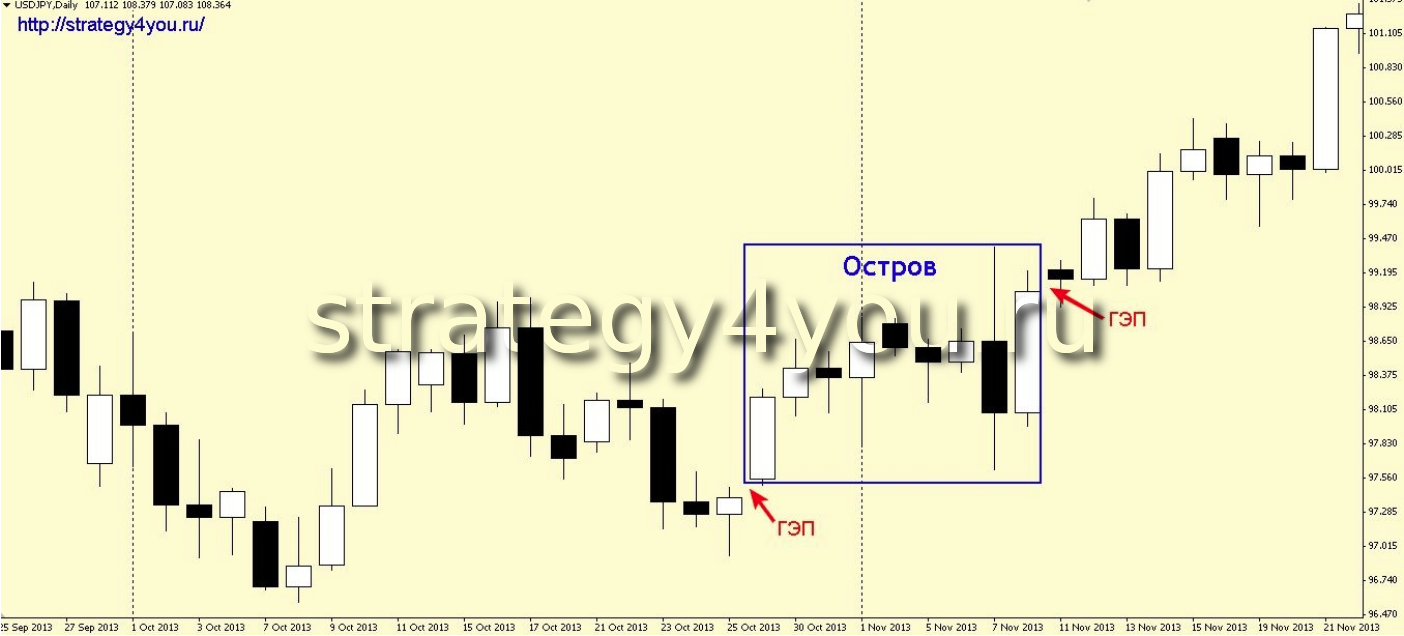
Example 2:
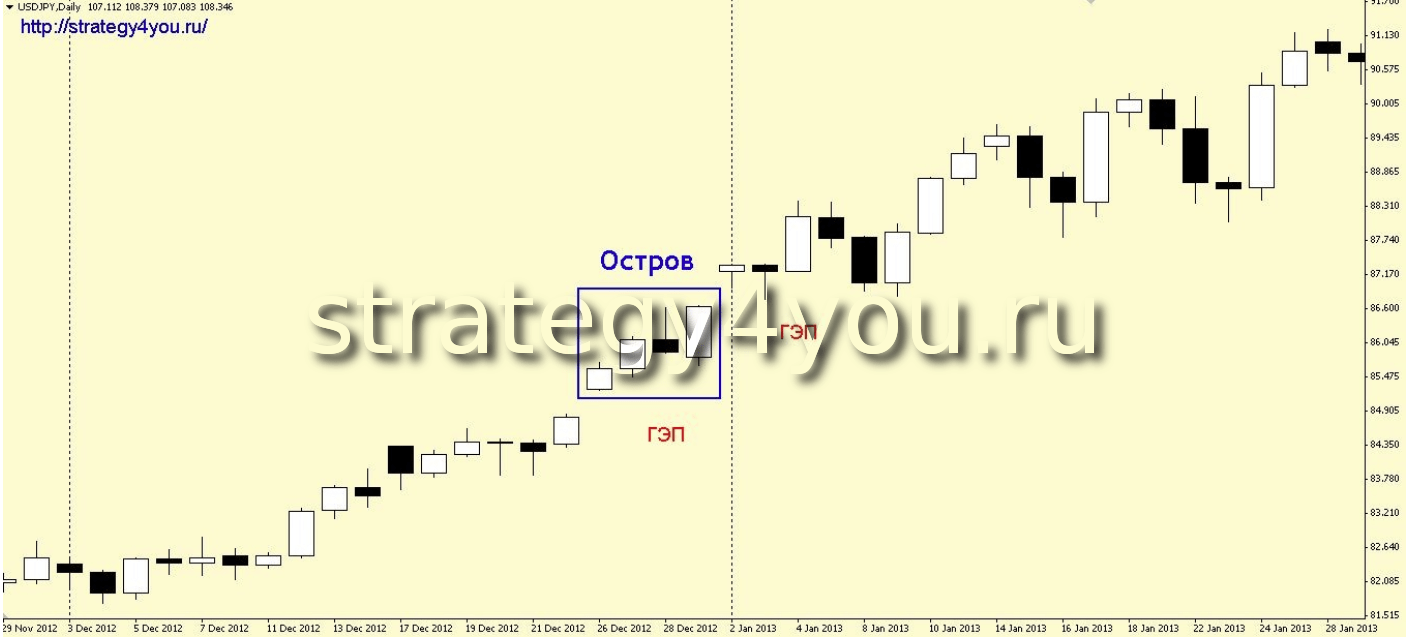
Example 3:
Example 4:
Video for the trading strategy of the “Long Island” pattern:
And video 2:
![LONG ISLAND Pattern [Forex & Crypto Trading Strategy]](https://strategy4forex.com/wp-content/cache/thumb/f6/257688a3c8890f6_320x200.png)