In this publication, we will get acquainted with the trading strategy of a rather effective price model / Pattern “Tube bottom / Tube top” and although at first glance it may seem that we are talking about a simple engulfing pattern or the “Rails” pattern, but in fact it is not, this model has some differences and quite significant additions.
The time interval is a week. On the daily charts, the model also works well, but its effectiveness decreases. If on weekly charts failures are only 5%, then on daily intervals it is already as much as 23%.
Since signals will not appear so often when trading on a weekly interval, this model can simply be added to the trader’s tools and when it is formed, look for entry points using other methods, and use the model as a pointer towards long-term movement.
- The trading instrument / currency pair can be absolutely any. Initially, this model was intended for the securities market and only after a while it spread among currency traders.
The description of the model will be given only for BUY,
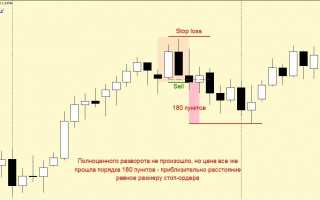
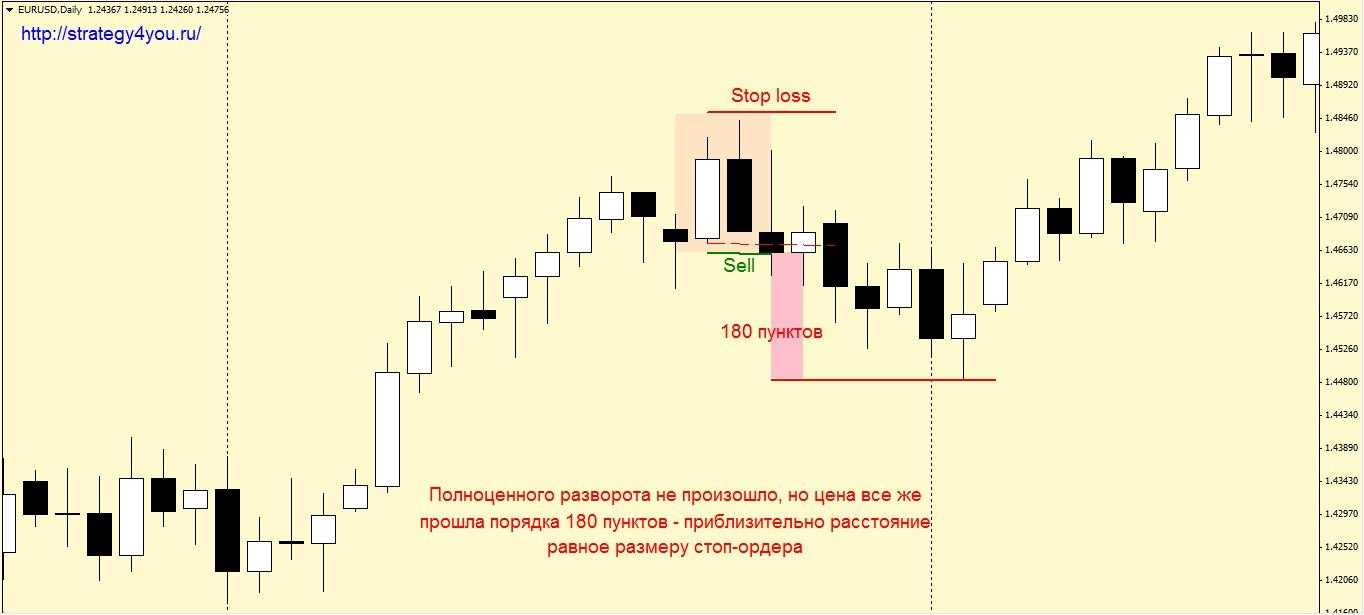
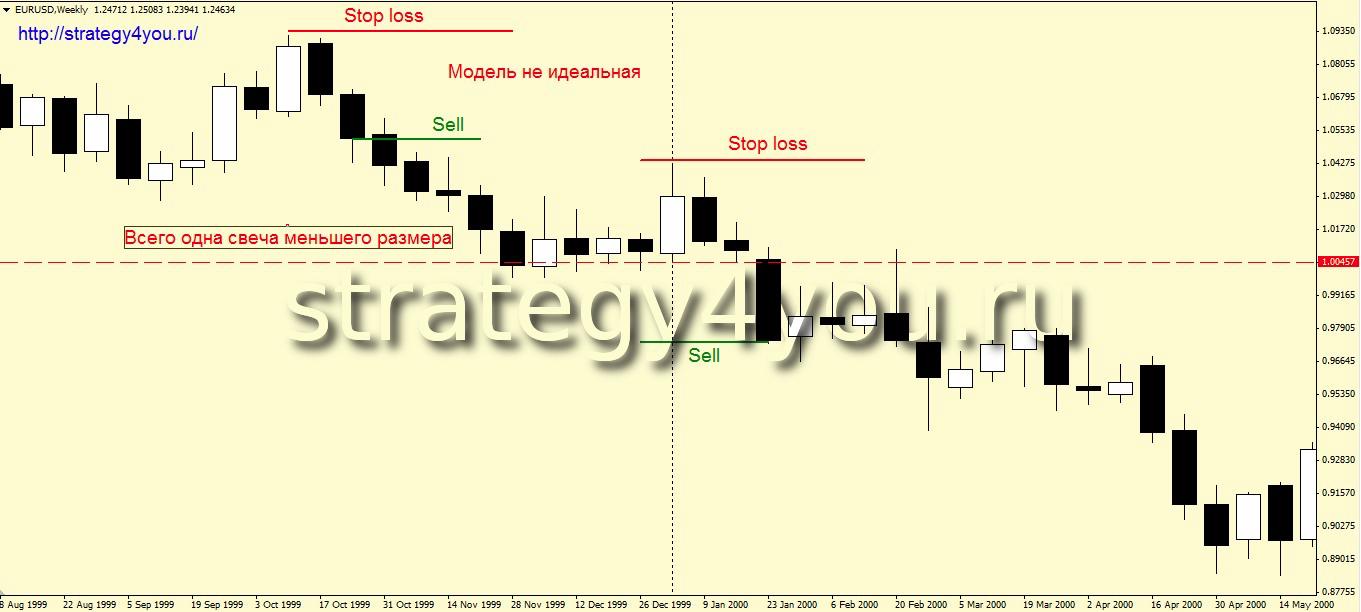
but it should be understood that the same applies to sales, only in a mirror form.
1) In a relatively calm market, two candlesticks appear that clearly stand out in size upwards from the previous candlesticks. Ideally, these should be two oppositely directed candles, that is, the first is black and the second is white, where the second candle absorbs a significant part of the price range of the first candle.
However, this pattern can also be formed by two candles with small bodies (the color doesn’t really matter) and with long tails from below, that is, when determining the size of a candle, its entire range should be followed, and not just the size of the body.
Very often, such a model indicates a reversal of the previous trend, but it works much better at the point of completion of the correction. That is, a correction is formed on the existing uptrend, at the minimum of which a “pipe-like bottom” is formed, which indicates the soonest completion of the correction and the resumption of the main trend.
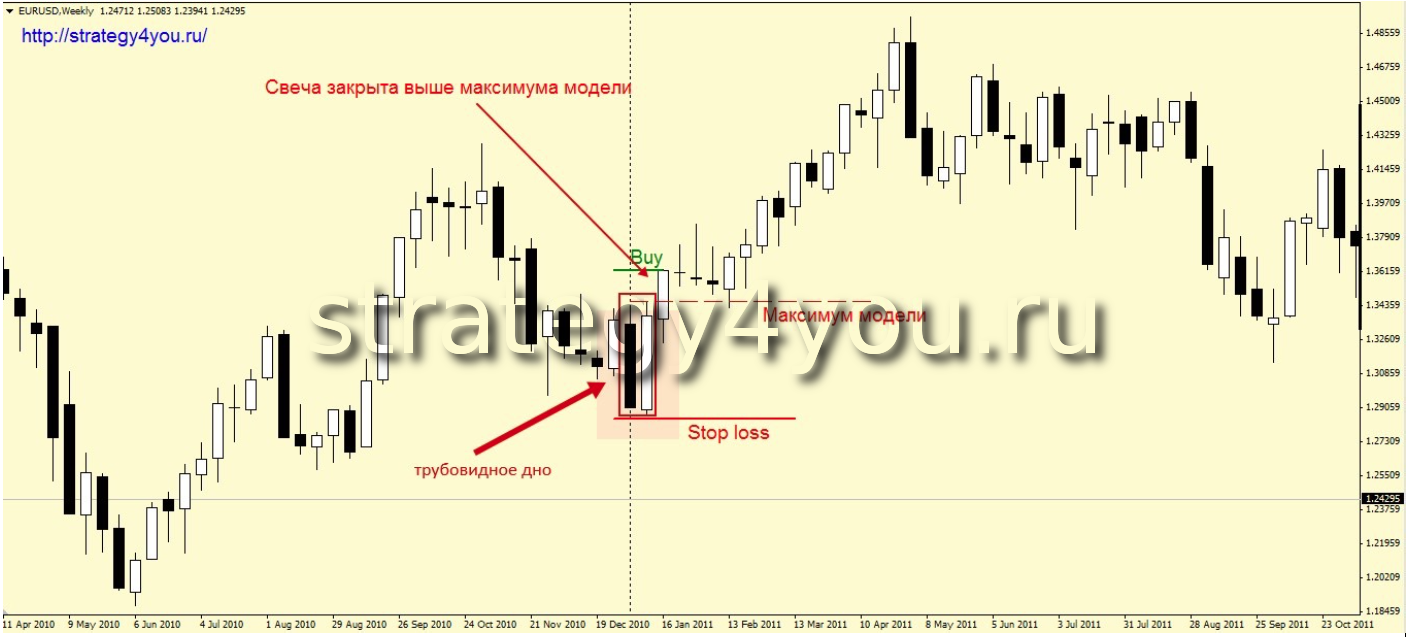
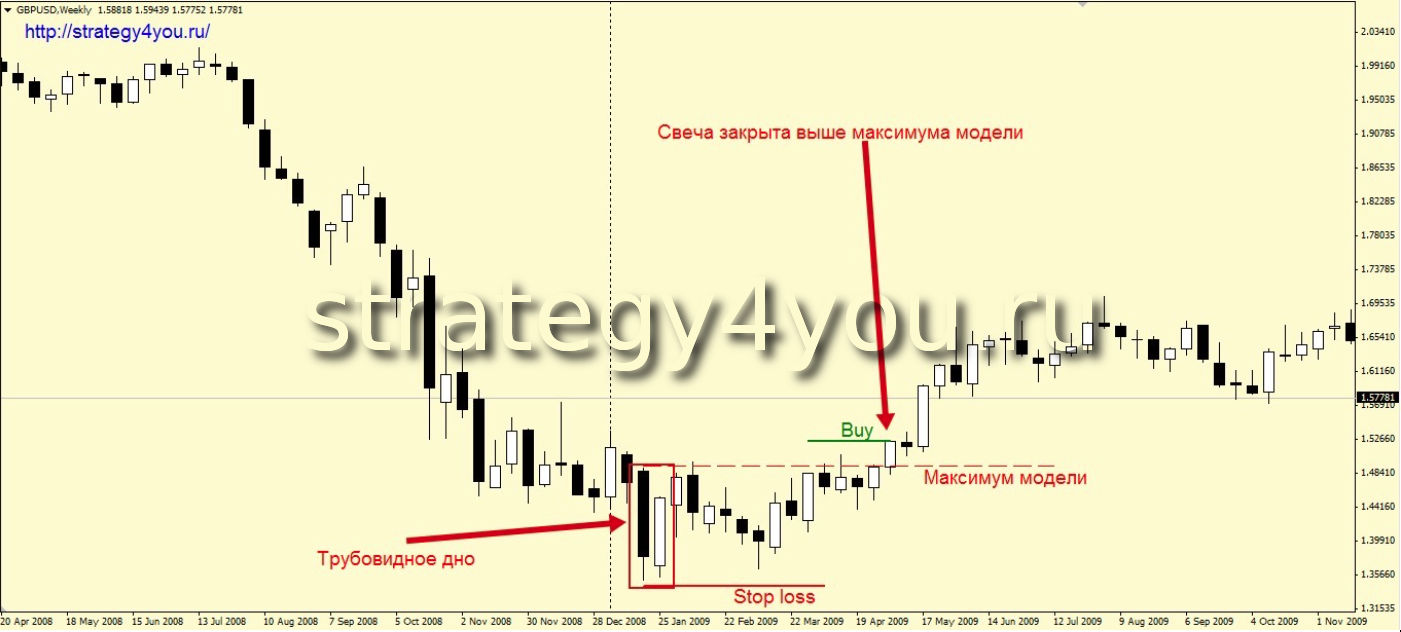
2) Entry into the market is carried out as soon as the next candle closes above the maximum value of the model.
3) Stop-loss order should be set below the minimum level of the tubular bottom.
If the entry was made at the point of completion of the correction, then the profit can be fixed by the levels of fibonacci extension stretched to the correction itself.
If the entry was made at a trend reversal point, then profit can be fixed on previous highs or using other graphical tools and more. In any case, it should be understood that the appearance of this model in most cases portends a rather serious movement.
Additions to the Trading Strategy “Tubular Patterns: Bottom and Top”:
1) The pattern is considered formed only after the breakdown and closing of the next candle above the high of two sharp candles of the tubular bottom.
2) Wide and long models work better than narrow and short ones.
3) very often, after the model is fully formed, the price returns to testing the minimum value of the model. This must be taken calmly.
4) Pipe patterns that are “inside weeks” work better than “outside weeks” (“Inside week” is the week in which the trading range of the right (second) candle is within the range of the previous candle. “Outside week” is the second candle with a higher high and lower low than the previous week).
A few examples of tubular models:
Example 1:
Example 2:
I don’t attach any templates and indicators, since the forex strategy is graphical…