Pin Bar is a concept in trading, without which stock market participants will not be able to determine that a highly effective signal has formed to enter against the trends. This pattern is referred to as the Price Action technique.
What is a PinBar
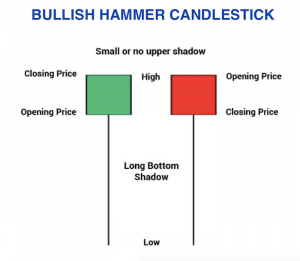
There are many charts and patterns in trading that show where price and demand will go next and how the trade can end, and the Pin candlestick is one of these patterns. It is also called «Royal Candle», «Price Action Setup Emperor» or «Pinocchio Bar», which reflects its characteristics well.
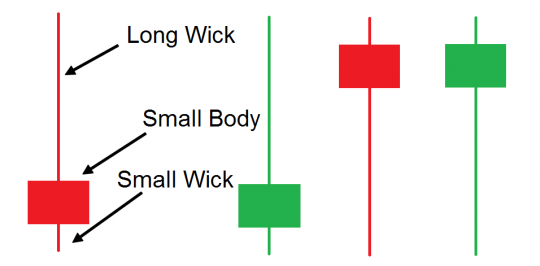
You can recognize a candle by external signs:
- small body;
- short nose;
- long tail-shadow.
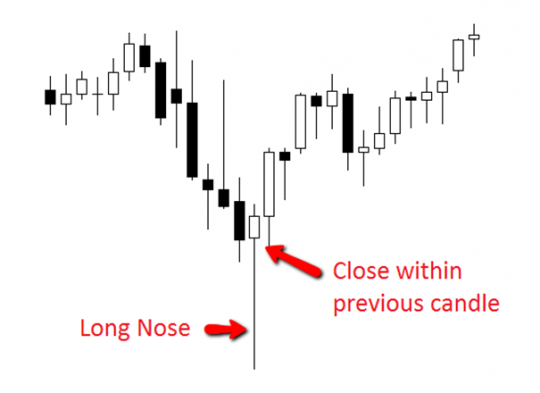
Royal bar — is a reversal pattern consisting of 1 candlestick. It has a large trading range and a contrastingly small difference between the open and close of the bar candle. You can also notice the pattern by a long shadow directed against the trend.
Where do pinbars form?
A candle on the trading chart is formed in the place where the price grew during the time period between the opening and closing of the trend, and then sharply turned around and went in the opposite direction. Experienced traders note that the longer the shadow of the pin bar, the higher the probability of not getting income from the transaction.
Pin candles form both above and below the charts. The shadow from their body can fall both up and down.
Similarities to Candlestick Patterns
Beginners may confuse a candle with a pin, and this is due to the fact that the pattern has similarities with such bars as the Hammer, Shooting Star and Inverted Hammer. You can distinguish, for example, the first model by a shorter nose, while the Shooting Star has a visually similar body to a regular square and may lack a lower shadow. The inverted hammer is preceded by a long candle, which distinguishes it from the Shooting Star.
Pins differ from candles in several ways. Firstly, they continue to be effective on small timeframes. Secondly, the body size of pin-candles is 2-3 times smaller, the shadow from it. Third, the movement is sharp with a tendency to return to its beginning.
You can also see a candle of a reversal pattern with in the Tweezers model. In this case, the setup indicates that the trader can enter the deal and hold positions already in the new exchange scheme.
Pin Anatomy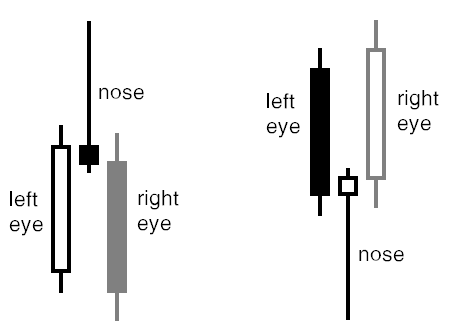
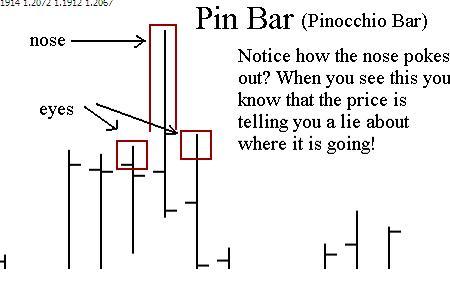
The pin-candle consists of a tail, a body and a nose. Each of these parts has its own meaning. For example, the length of the shadow-tail indicates whether there was a false breakdown of the level or a rollback. Because of the fake breakout, this pattern is called the Pinocchio bar.
The tail shadow of the imperial setup should be about 70-75% of the total length of its body or more. At the same time, the royal candle itself on the chart is 25-30%, no more. In addition, the shadow must be longer than all the nearby tails of other candles.
Pin bars (their bodies) can be red or green depending on the trade price. If the closing price was lower than what was required at the start, then the body is red, and if it is higher, then it is green. The body of the pattern may be small or absent, and this also depends on the opening and closing prices.
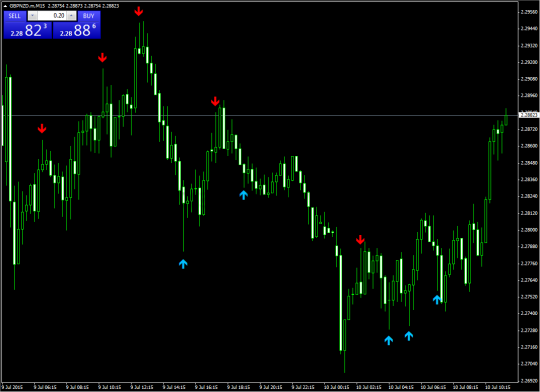
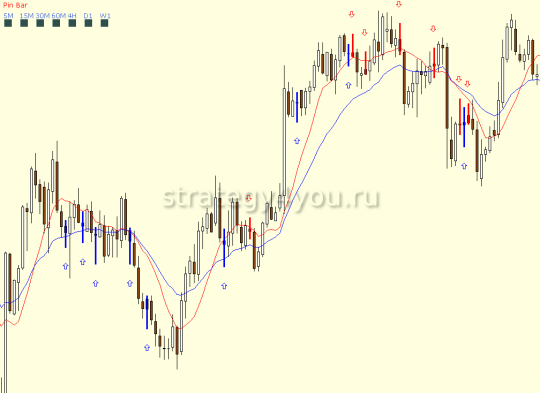
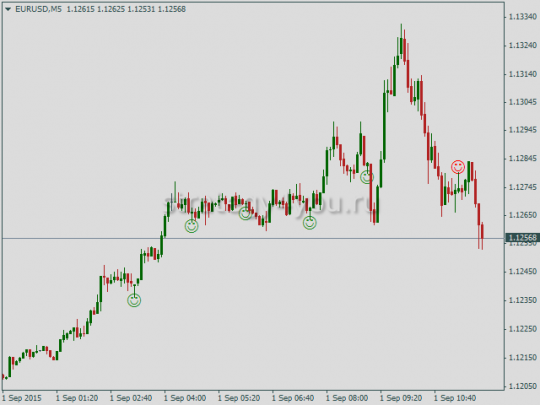
The pin bars indicator allows you to identify them on the chart for the MetaTrader4 trading terminal:
The most common of them:
1) PinBar (you can download it in the archive for the MT4 trading terminal).
2) MTF PinBar Scan (also in the archive for MetaTrader 4).
3) Pinbar-detector — similar in the archive for MT4.
The nose of the Royal bar is small and forms in most cases a few seconds before the deal is closed.
Kinds
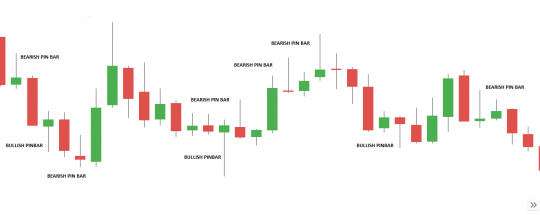
 Despite the apparent simplicity in the description, pins come in 4 types:
- Bullish with a long shadow.
- Bullish with a short shadow.
- Bearish with a long shadow.
- Bearish with a short shadow.
Bullish pin bars with a long tail are considered effective for a trader if have a red / black body, and with a short one — green / white. The same situation is with bearish candles. Entering the game, the trader must remember that the desired color of the indicator body will bring him benefits.
How to use in trading
Having figured out what a pin bar is, a beginner needs to understand how to use it. Those who are new to trading love to trade when a reversal scheme appears. There are several strategies for playing with royal candles:
- aggressive with an entrance at the opening of the bar;
- aggressive with entry after a period of time;
- conservative.
Experts note that the choice of strategy should depend on the feelings and preferences of the player, and it does not matter which model to use. At the same time, it will be an additional bonus if the tail of the pin breaks the Fibonacci line or the dynamic level. The ability to set a stop loss is also useful.
An example of a strategy:
Method 1: Aggressive
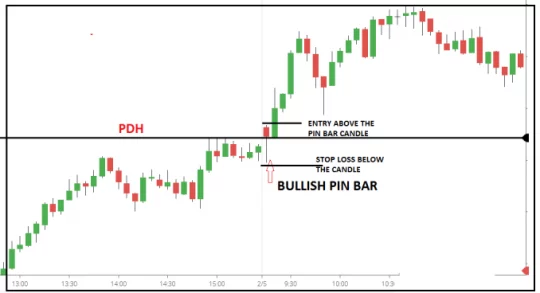
An aggressive way to enter a trade using the pin indicator is to enter the game in the usual way and place a stop loss above the tail going up or down at around 50-60% of the candle range . The method is used when they do not have time to take advantage of the closing of the previous Royal bar and the subsequent growth of a new candle.
Method 2: also aggressive
Method No. 2 is used in daily trading, as their range is limited. In this case, you need to use pending stop orders.
They buy securities if the price reaches the limit buy stop above the level of the shadow of the royal candle. I dump assets if the price reaches the sell stop point located below the imperial Price Action setup.
Method 3: conservative
The pin bar strategy, called conservative, is to enter the Stock Market (FR) or the forex market with a small pullback. You need to get into a trade between 38% and 55% of the rollback zone.
The scheme is designed to work in daily charts and a large pin. The process of pullback and reversal of this pattern can take from 12 hours to 14 days. In this case, the risk between profit and loss increases, but the stop loss also decreases.
Reasons for the appearance
The pin bar pattern has multiple permanent causes and is created when delayed interest kicks in. The indicator depends on:
- sellers;
- buyers;
- demand.
Sellers can be both large and small market participants. They take control of the price of an asset and push it in the direction they want. At the same time, the purpose of manipulations with this case does not matter.
The pin bar, the chart of which appeared on the monitor, is also formed from the actions of buyers. In this case, the players interested in acquiring the asset put pressure on the sellers and pushed the price up or down according to their needs and interests.
Movement mechanism
A bar in trading is a candle, and the mechanism of its movement depends on a combination of different factors. For example, the price grew, but then the interest of the FD players subsided, they stopped buying assets, and the price turned around and went down. Most of the traders who paid attention to this candle had stop-losses hit, which was the purpose of the reversal .
The resulting setup appeared due to the fact that after the price fell, other exchange traders, who expected such a development of events, put their assets up for sale. After such manipulations, a small body and a long shadow tail are formed at the bar.
What happens inside the pin
The indicator of imperial setups contains hidden processes, without which it is impossible to transform the candle of this pattern. As an example, consider 60 seconds and 5 minutes in the life of an hourly bar.
In each of the time intervals, a sharp jerk of the price or a uniform movement in the opposite direction is possible. The first case, when a sharp price spurt is observed inside the candlestick and after a short period of time its confident rollback, happens in small time intervals and is more typical for 60 seconds than for 5 minutes.
In the context of a five-minute interval, a uniform movement in the opposite direction is more often observed. This behavior is typical during the formation of a V-turn. This event can happen in 60% of cases because of the news.
Less common is the paranormal behavior of the royal candle. In this case, the pin can transform into another similar indicator. In this case, the new pin will differ from the previous one by a smaller body size.
How to trade: trading strategy
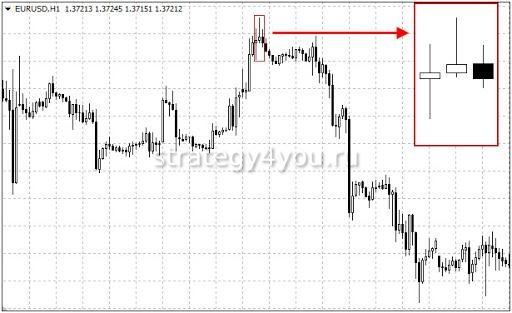
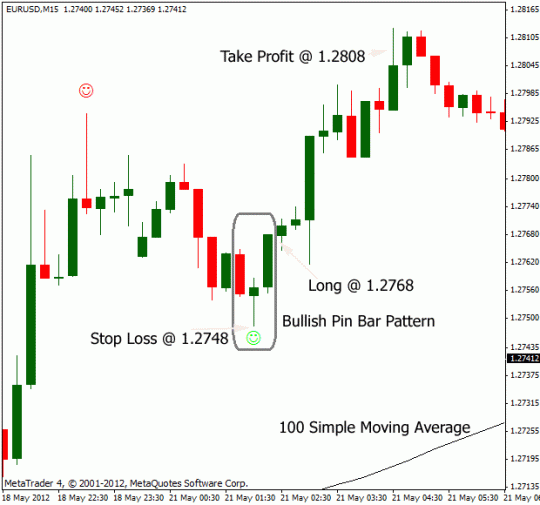
To trade using any reversal indicator for MT4, you need to remember that a trade is entered against the trend, i.e. towards a new emerging direction. For this pattern to work, the Imperial Price Action setup must have a small body and a long tail.
Example — Forex Strategy:
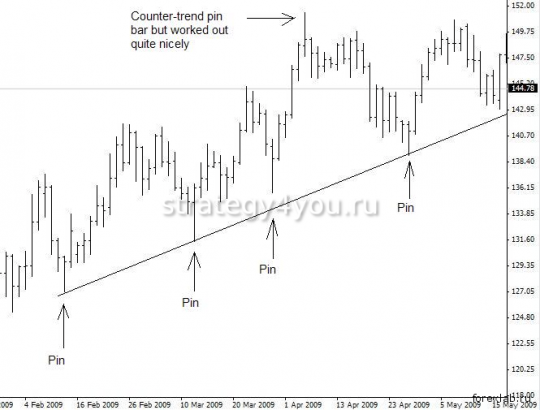
You can also trade using this reversal indicator by entering a trade following the trend. In this case, there can be no doubt about the profitability of the event.
Trading mistakes
There are 3 common mistakes made by newbies who want to
earn using reversal indicators. These include:
- General interpretation of each pin.
- The indicator is given a lot of time.
- Waiting for a market reversal after a pin appears.
It happens that novice traders interpret all pins the same way. When working with indicators, it is recommended to pay attention to the candles that preceded the appearance of the imperial Price Action setup and their shadows. For example, if a royal candle with a bearish body and a long tail is lit on the chart, and before that, small bars were observed on the screen, then this is a hint that a trend reversal should be expected.
Novice traders spend a lot of time looking for an indicator to enter a trade. In this case, the player is at risk of missing weekend trading opportunities.
If you observe the behavior of the indicator going against the trend, you can find that the trend will continue.
Conclusion
For those who understand the types of imperial setups and their behavior, this tool can bring good profit when trading on FR and Forex. Both classical and paranormal indicators work equally well. For the strategy to work, it is recommended not to forget to carry out graphical analysis and analysis of other data.
The tool in question is good in that it can also be used in intraday trading. The indicator is easy to use and is an effective candlestick model for beginner traders.



![Pin bar [Forex, Crypto and Stock Market] in Trading: what is it, trading method, type of Pin Bar](https://strategy4forex.com/wp-content/cache/thumb/bc/910994e3bea20bc_320x200.png)